Transforming Geospatial Information (GIS) into urban knowledge in Baia Mare


GIS work by relating data to geographical and physical spaces through indexed keys. Potential locations for GIS data collection and analysis extend into Earth's space, which are represented by longitude, latitude, and elevation coordinates.
GIS can also link the space and time of a specific datum. They help analyse urban scenarios and allow professionals and decision-makers to access information to take data-driven actions. Innovative technology supports understanding and describing the changing urban realities through time, striving to bring new components and solutions to complex urban issues.
The SPIRE project has implemented an iGIS smart mapping and monitoring system for five pilot sites that will provide healed land for the future of Baia Mare. The SPIRE Project uses phytoremediation techniques to clean up contaminated land and remove Heavy Metals from these five pilot sites, striving to restore and re-insert them into the urban ecosystem. The iGIS system includes on-site ground measurements of pollutants and satellite imagery, as well as predictive algorithms for site improvements due to phytoremediation activities.
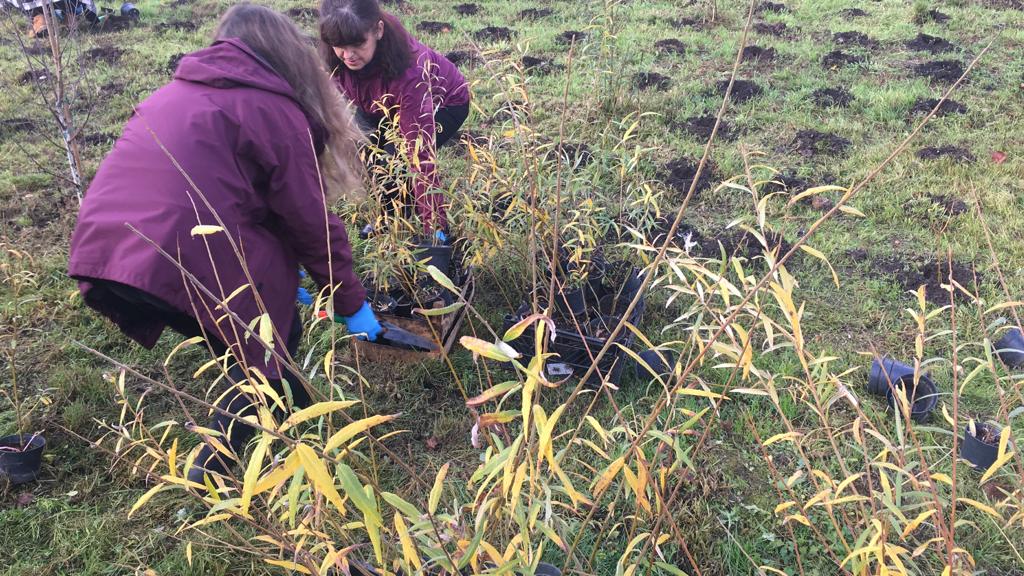 Fig. 2: Willows plantathlon October 2022. Source: SPIRE project
This smart system is underpinned by Copernicus, the Earth Observation Programme of the European Union, which looks at our planet and its environment for the maximum benefit of all European citizens. It offers information services based on satellite Earth observation data and on-site (non-space) data. The information services provided are free and have open access for its users. SPIRE iGIS is available at: https://spire.city/index.php/igis/
Gathering data
Data collection in urban settings is a comprehensive and exhaustive process. Uncertainty plays a vital role in data gathering within cities, as we are immersed in a dynamic system full of multiple interconnections. These interconnections include the implementation of basic infrastructures, facilities, and improvements; mobility and the continual growth of telecoms and its networks; the evolution of economic and social features, built environment development, public spaces planning; and the possibility of a natural disaster or a disease outbreak and their consequences, such as COVID-19.
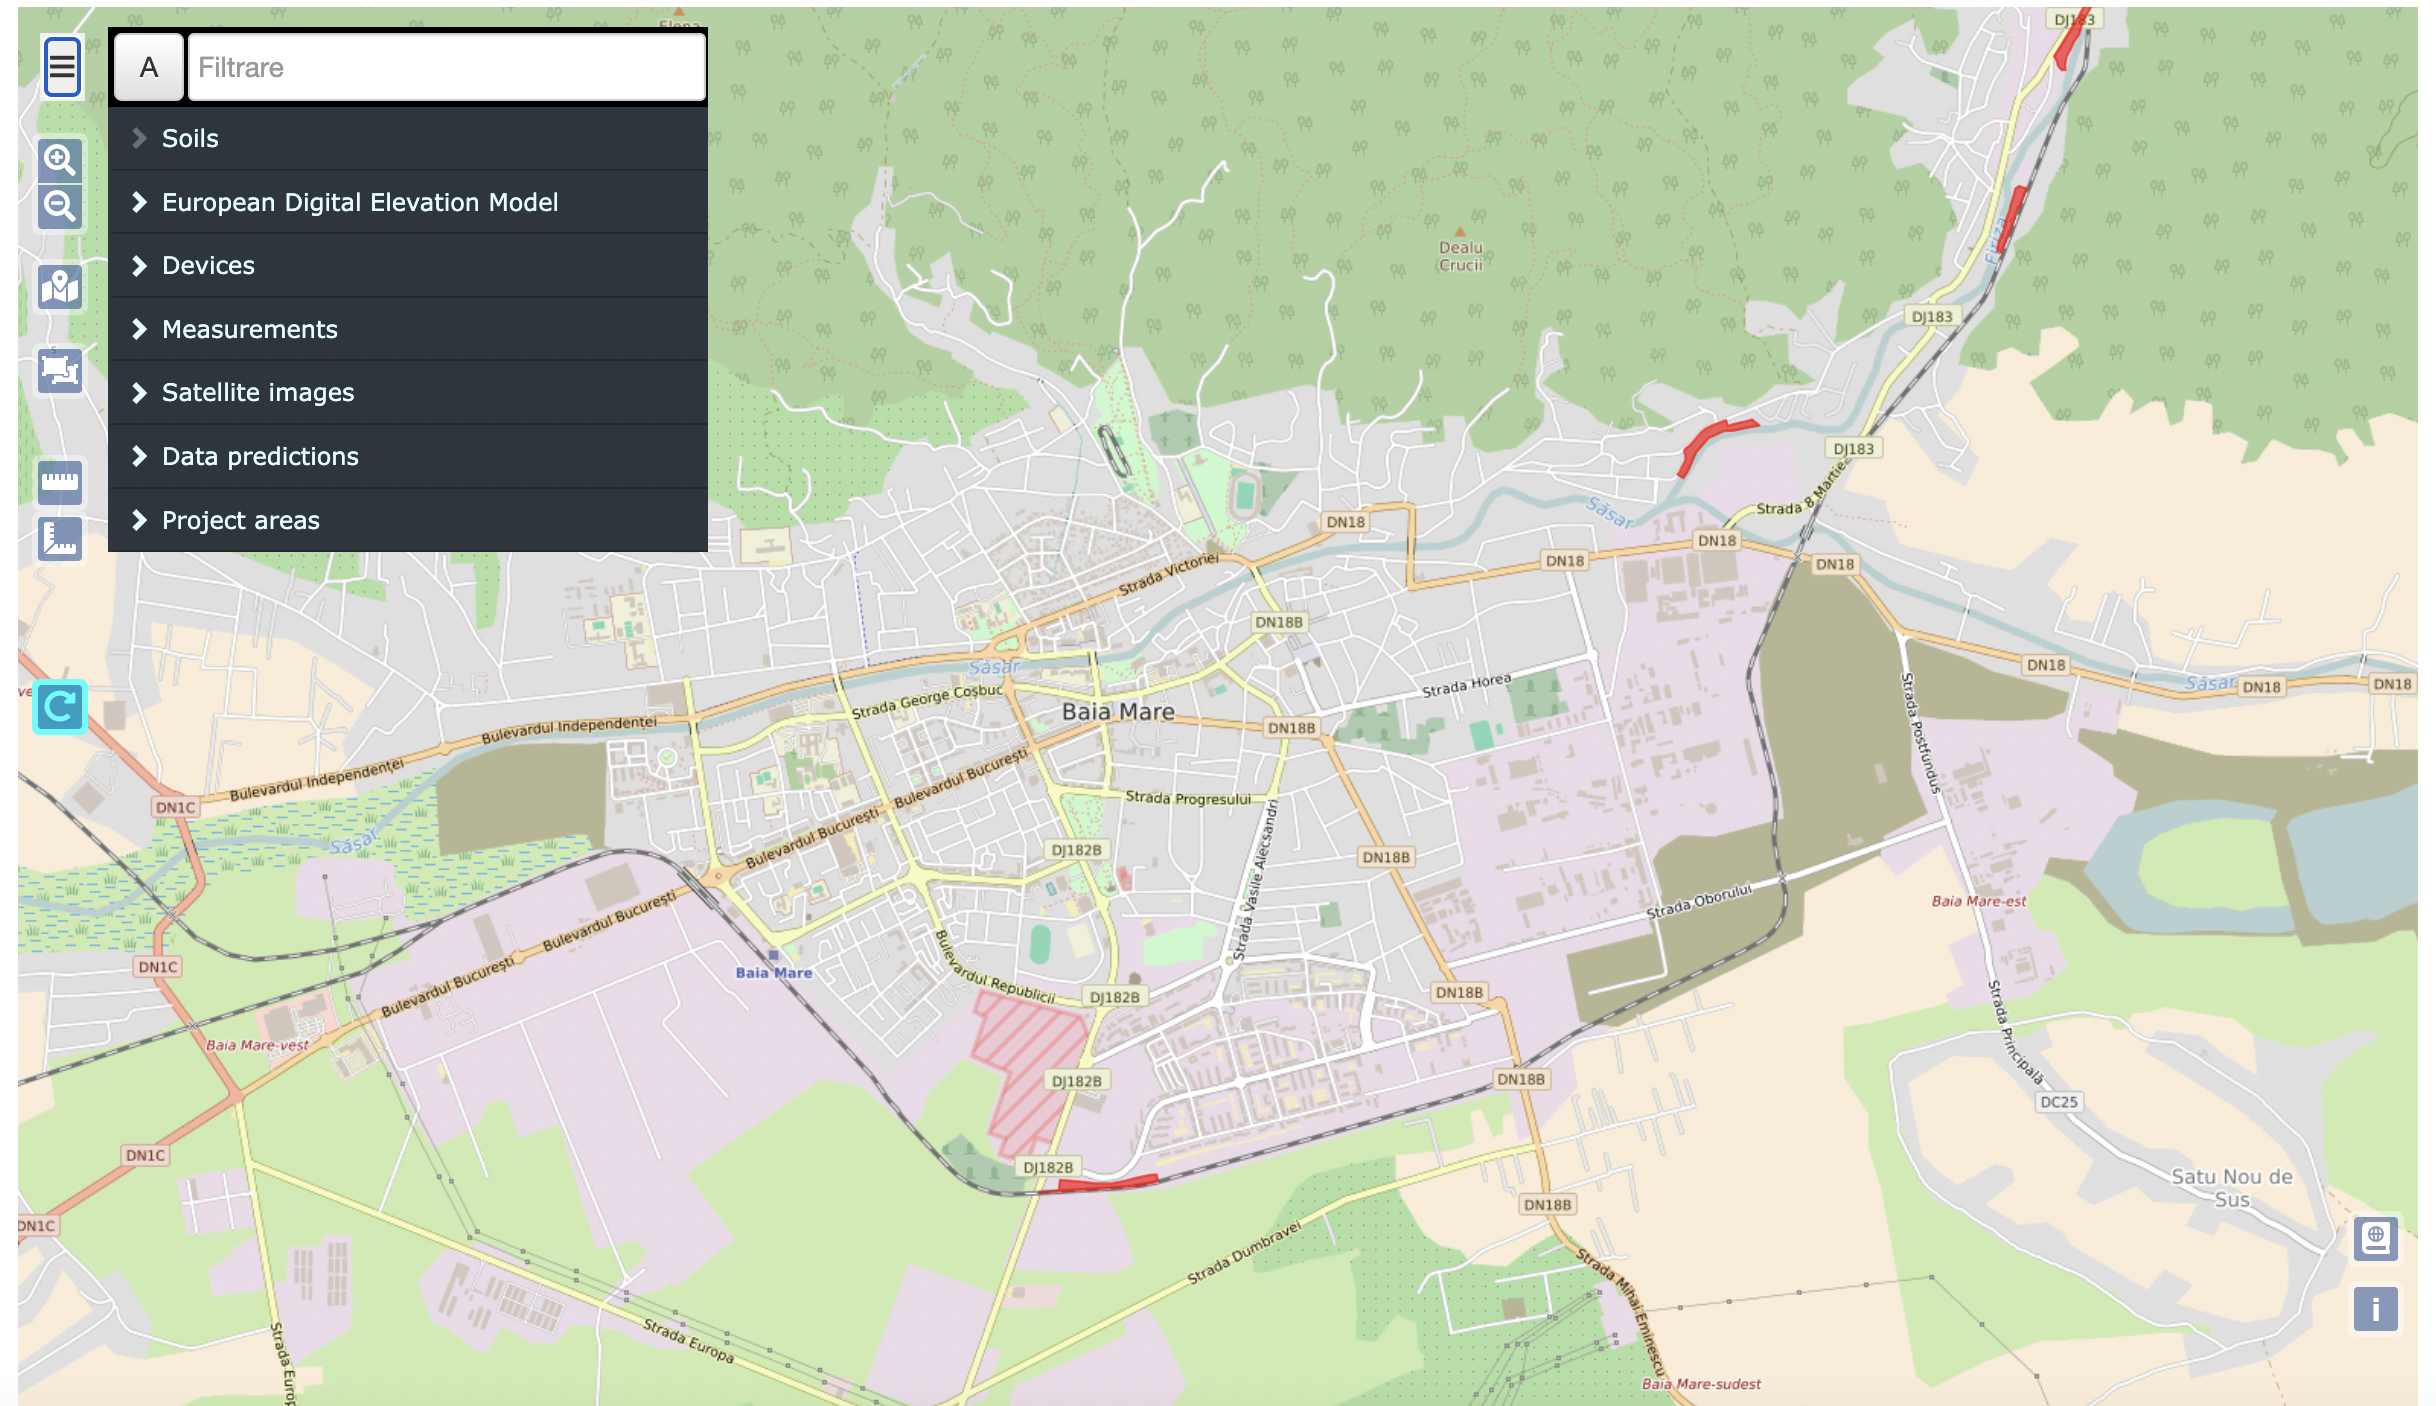 Fig. 3: Baia Mare and the 5 pilot sites to be recovered through Nature-Based Solutions - NBS - (in red). Source: SPIRE project
Future projections and calculations shape the urban space, and a political and ethical imperative exists to plan for and manage any uncertainties. The process of data collection is becoming more and more demanding, and GIS has evolved into a sub-category of science. On the one hand, data is captured through the digitization of existing information (e.g., scanned maps, digital elevation models, and surveys), which are embedded in the GIS space; on the other hand, data can be transferred or sampled (e.g., digital remote sensing images or digital aerial photographs).
The smart SPIRE iGIS gathers site ground analysis data, which is available thanks to USAMV; one of the members of the SPIRE consortium. The system locates the five pilot sites and provides information about soil analysis:
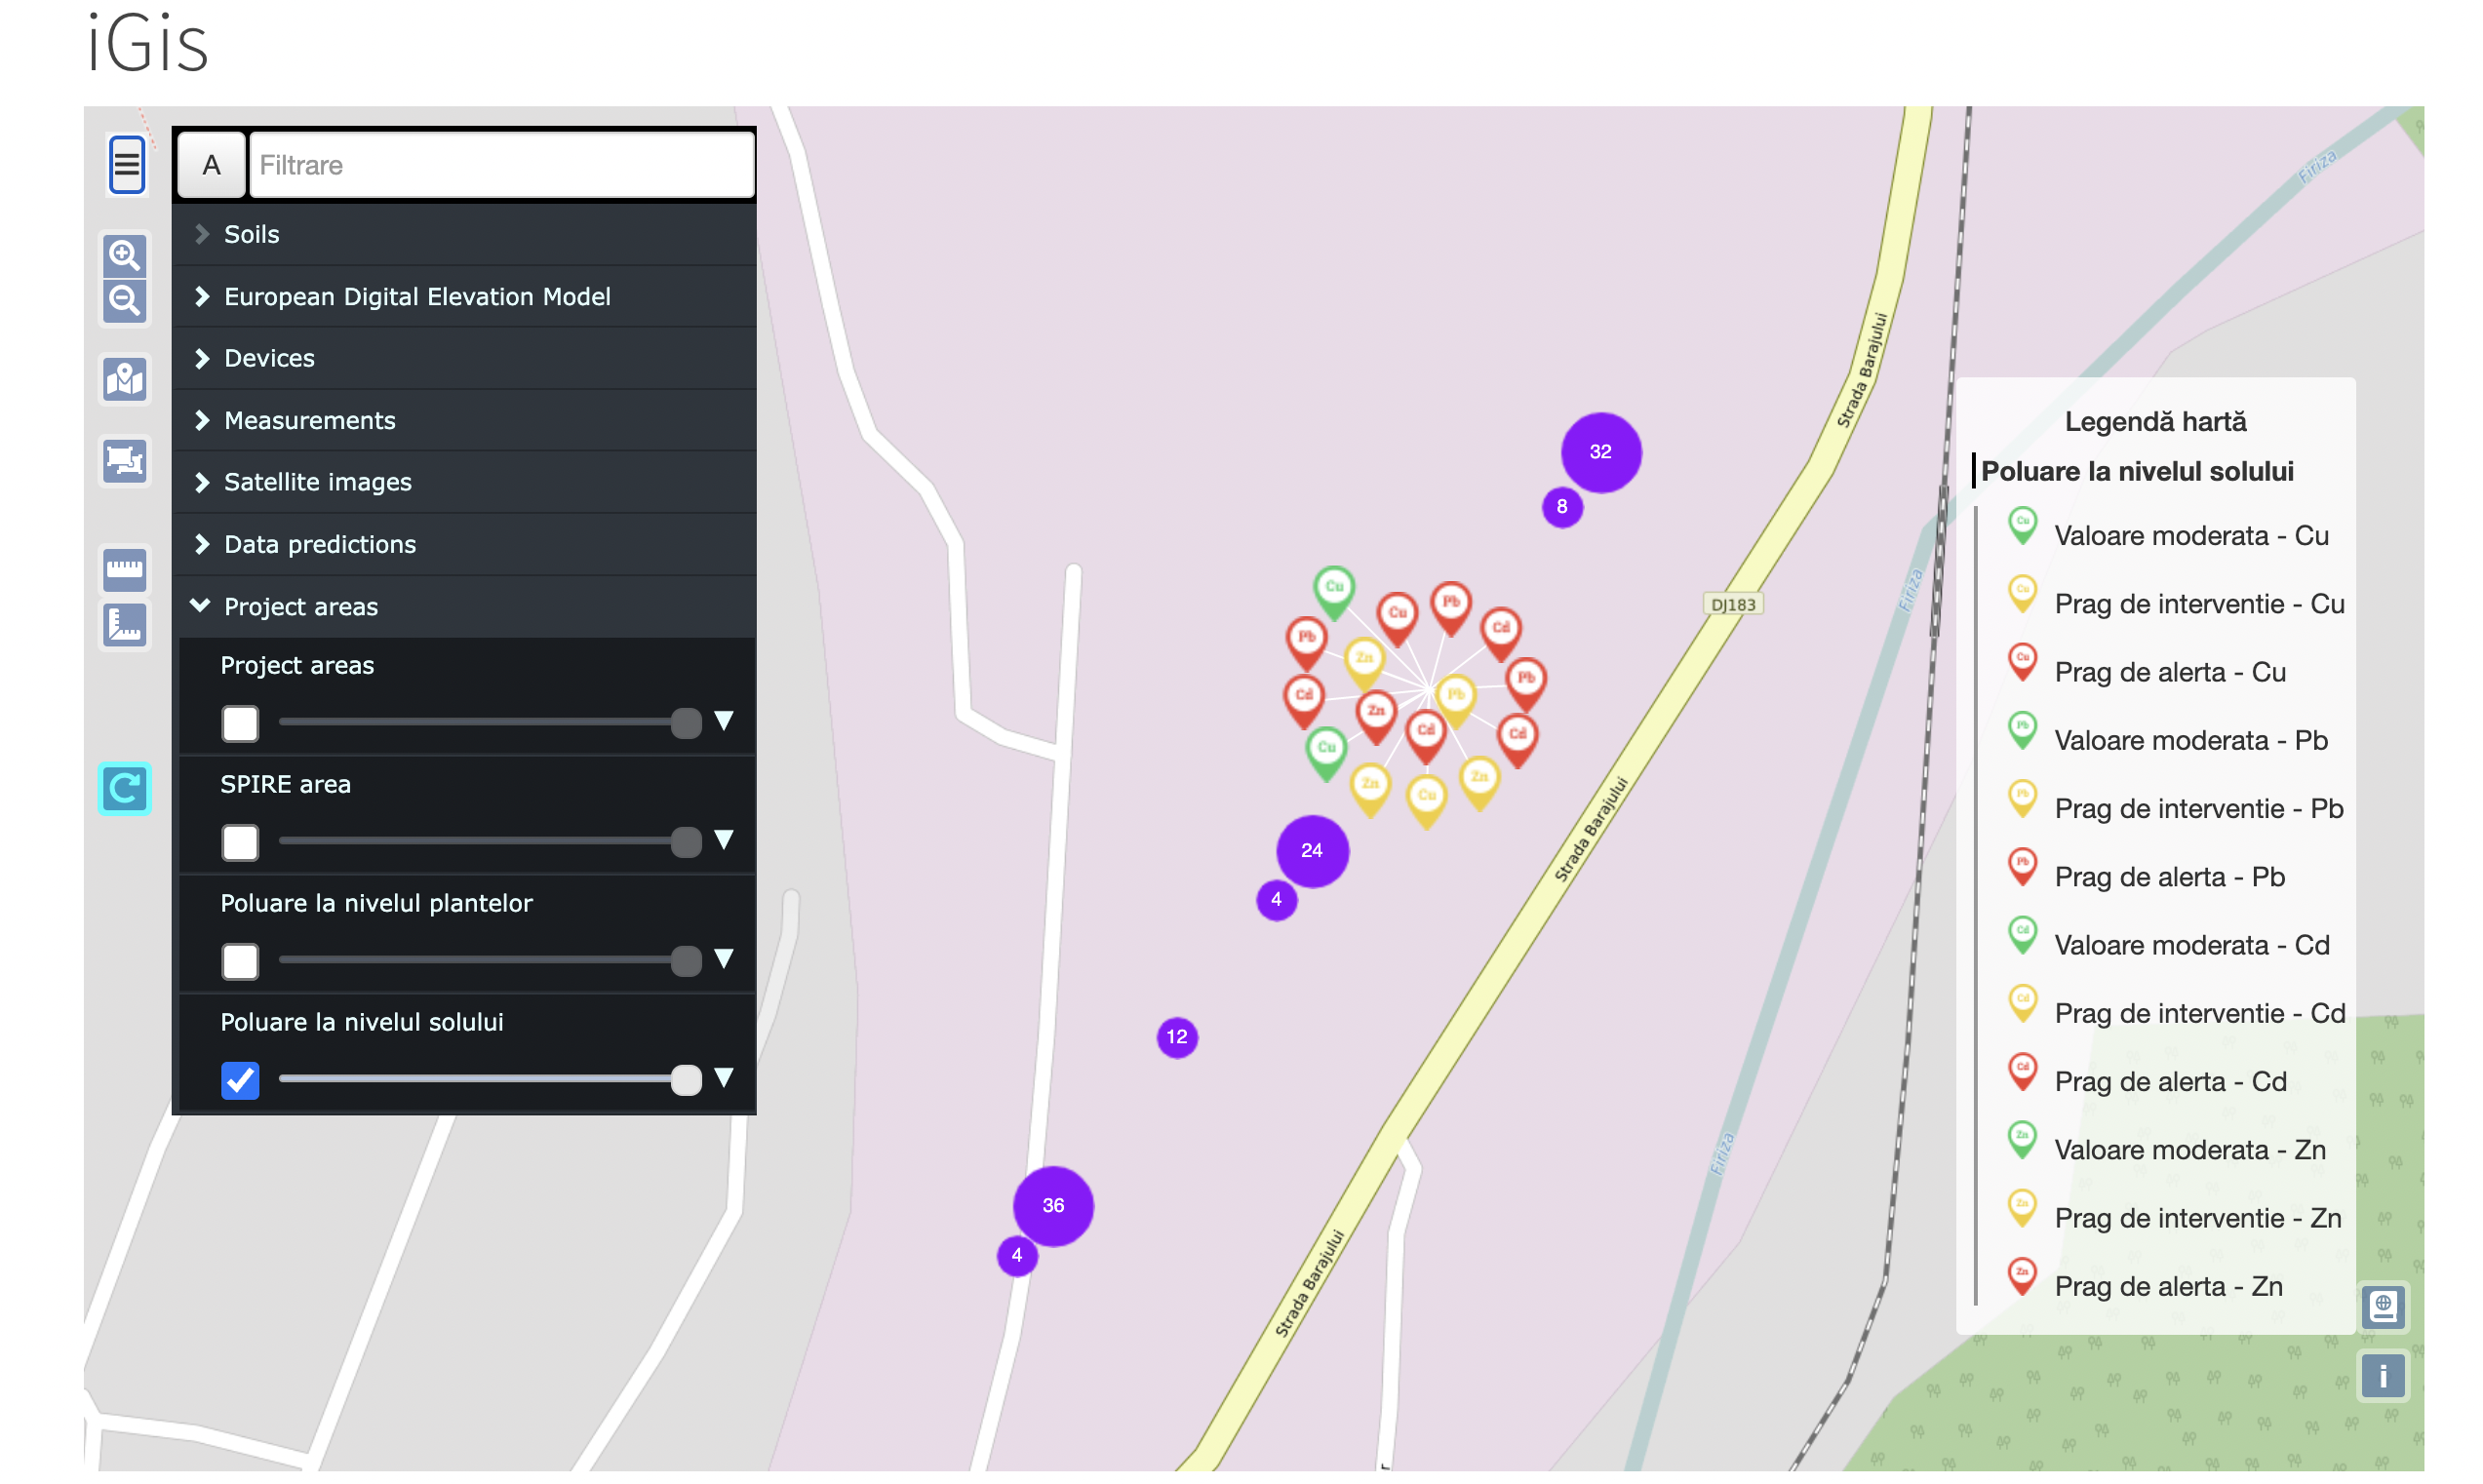 Fig. 4: Soil measurement. Source: SPIRE project
The phytoremediation techniques applied in Baia Mare remove the heavy metals from the soil using hyperaccumulator plants that can perform phytoextraction. To extract biomass from plants, existing species that currently perform phytoremediation at the pilot sites are integrated into the landscaping plan since they are well-adapted to the local conditions.
According to Order no. 756 of the 3rd of November 1997 (which is still valid today in Romania), the polluted land in Baia Mare falls under the LESS SENSITIVE land use category, which includes all existing industrial and commercial uses; as well as the land areas planned for such uses in the future.
|
Threshold according to law |
Heavy metal content |
|||
|
Pb |
Cd |
Cu |
Zn |
|
|
Normal values (mg/kg DM) |
20 |
1 |
20 |
100 |
|
Intervention threshold (mg/kg DM) |
250 |
5 |
250 |
700 |
|
Alert threshold (mg/kg DM) |
1000 |
10 |
250 |
1500 |
Legend: DM= Dry Matter / Dpth= Depth / Cd= Cadmium / Cu= Cupper / Ni= Nickel / Zn= Zinc / Cr= Chromium / Pb= lead / Co= Cobalt / Mn= Manganese / Col= Color
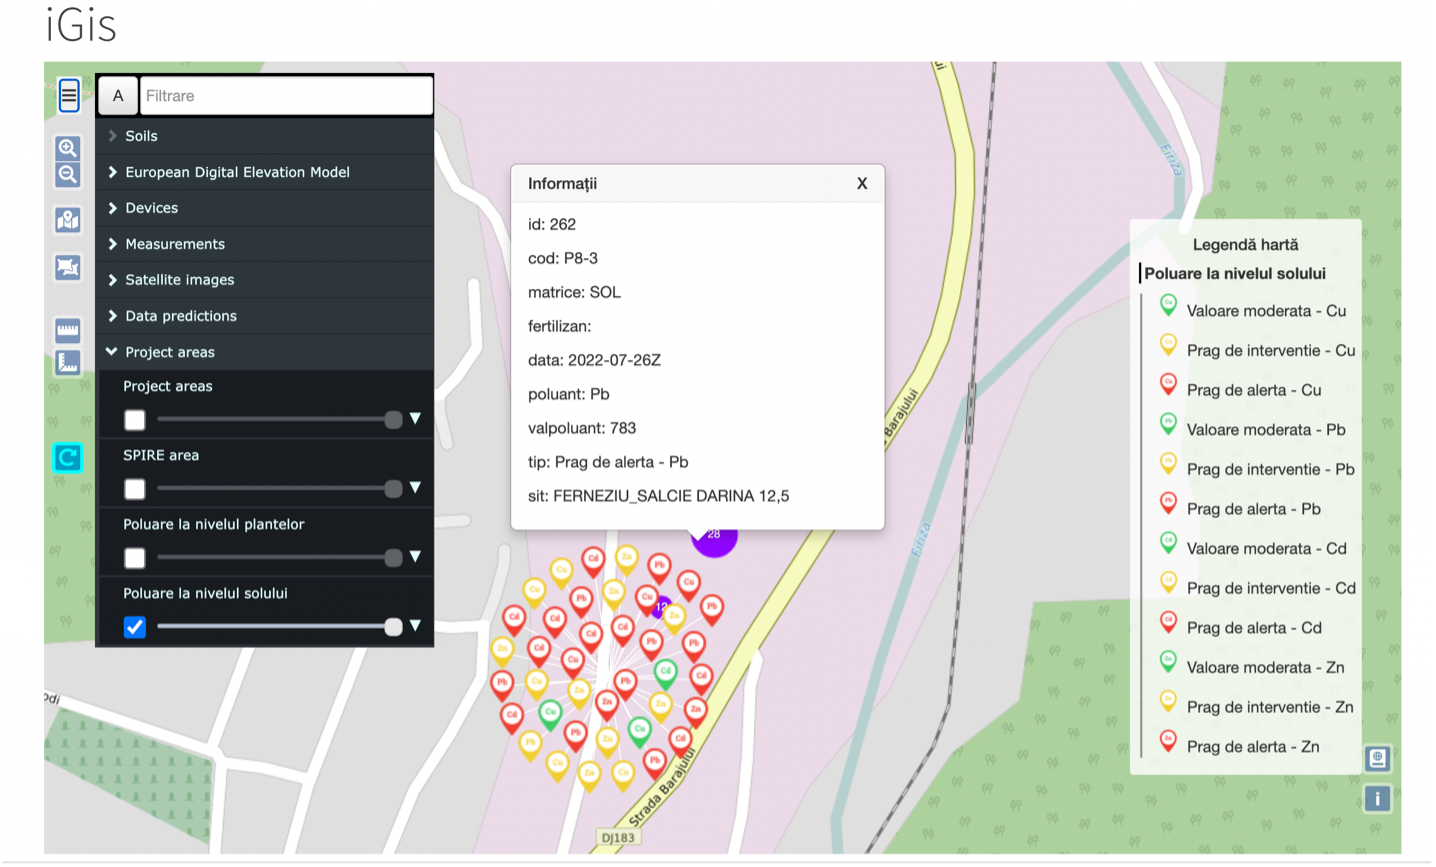 Fig. 5: Threshold and Soil measurement. Data about Heavy Metals. Source: SPIRE project
Also, a massive set of Sentinel-2 (a new fleet of European satellites explicitly designed to provide abundant data and images) specific imagery has been added, including all "cloud-free" images available through the Copernicus programme. Indexes:
RGB (Red, Green, and Blue) refers to a system for representing the colours to be used on a computer display. Red, green, and blue can be combined in various proportions to obtain any colour in the visible spectrum.
PSRI (Plant Senescence Reflectance Index) maximizes the index's sensitivity to the ratio of bulk carotenoids (alpha-carotene and beta-carotene) to chlorophyll. An increase in PSRI indicates increased canopy stress, the onset of canopy senescence, and plant fruit ripening.
NDVI (Normalized Difference Vegetation Index) determines the density of green on a patch of land. The distinct colours (wavelengths) of visible and near-infrared sunlight reflected by the plants can be observed.
NDWI (Normalized Difference Water Index) measures the amount of water in vegetation or the level of moisture saturation in soil.
NDSI (Normalized Difference Soil Index) highlights the difference between the strongest and weakest spectral responses of a target land cover.
BI (Brightness Index) is sensitive to the brightness of soils. High soil brightness is linked with soil humidity and salts in the soil.
CI (Chlorophyll Index) calculates the total amount of chlorophyll in plants.
Analysing and counterchecking data
Spatial analysis is a process that helps you look at a particular problem from a geographical perspective. This appraisal first begins with computer processing. Then, it investigates and scrutinizes the results.
Information filtering recognizes complex realities that share space and connects components. GIS acts as a vectorized database for pattern identification, linkage analysis, and materials tailoring, enabling interactive maps and multi-layered dashboards. The features come from vector data, raster or grid data, and images or pictures.
Local data analysis mechanisms are crucial for nature-based urban planning interventions. Since data and indicators are collected and analysed for further action, defining accurate and effective indicators is extremely important for Nature-Based Solutions (e.g., for PSRI, NDVI, NDSI, etc.). Information appraisal for relevant data and indicators (quantitative and/or qualitative) remains challenging at the local level. While some of these data are extrapolated from national statistics or existing surveys, many more specific and innovative indicators must be designed and collected.
GIS enables the combination of spatial data and metadata with attributes, proposing an effective and practical way of assessing different situations. It synthesizes information, which allows for the extraction of additional data, identifying spatial and geographical trends or features that might not be so obvious by simply looking at a map.
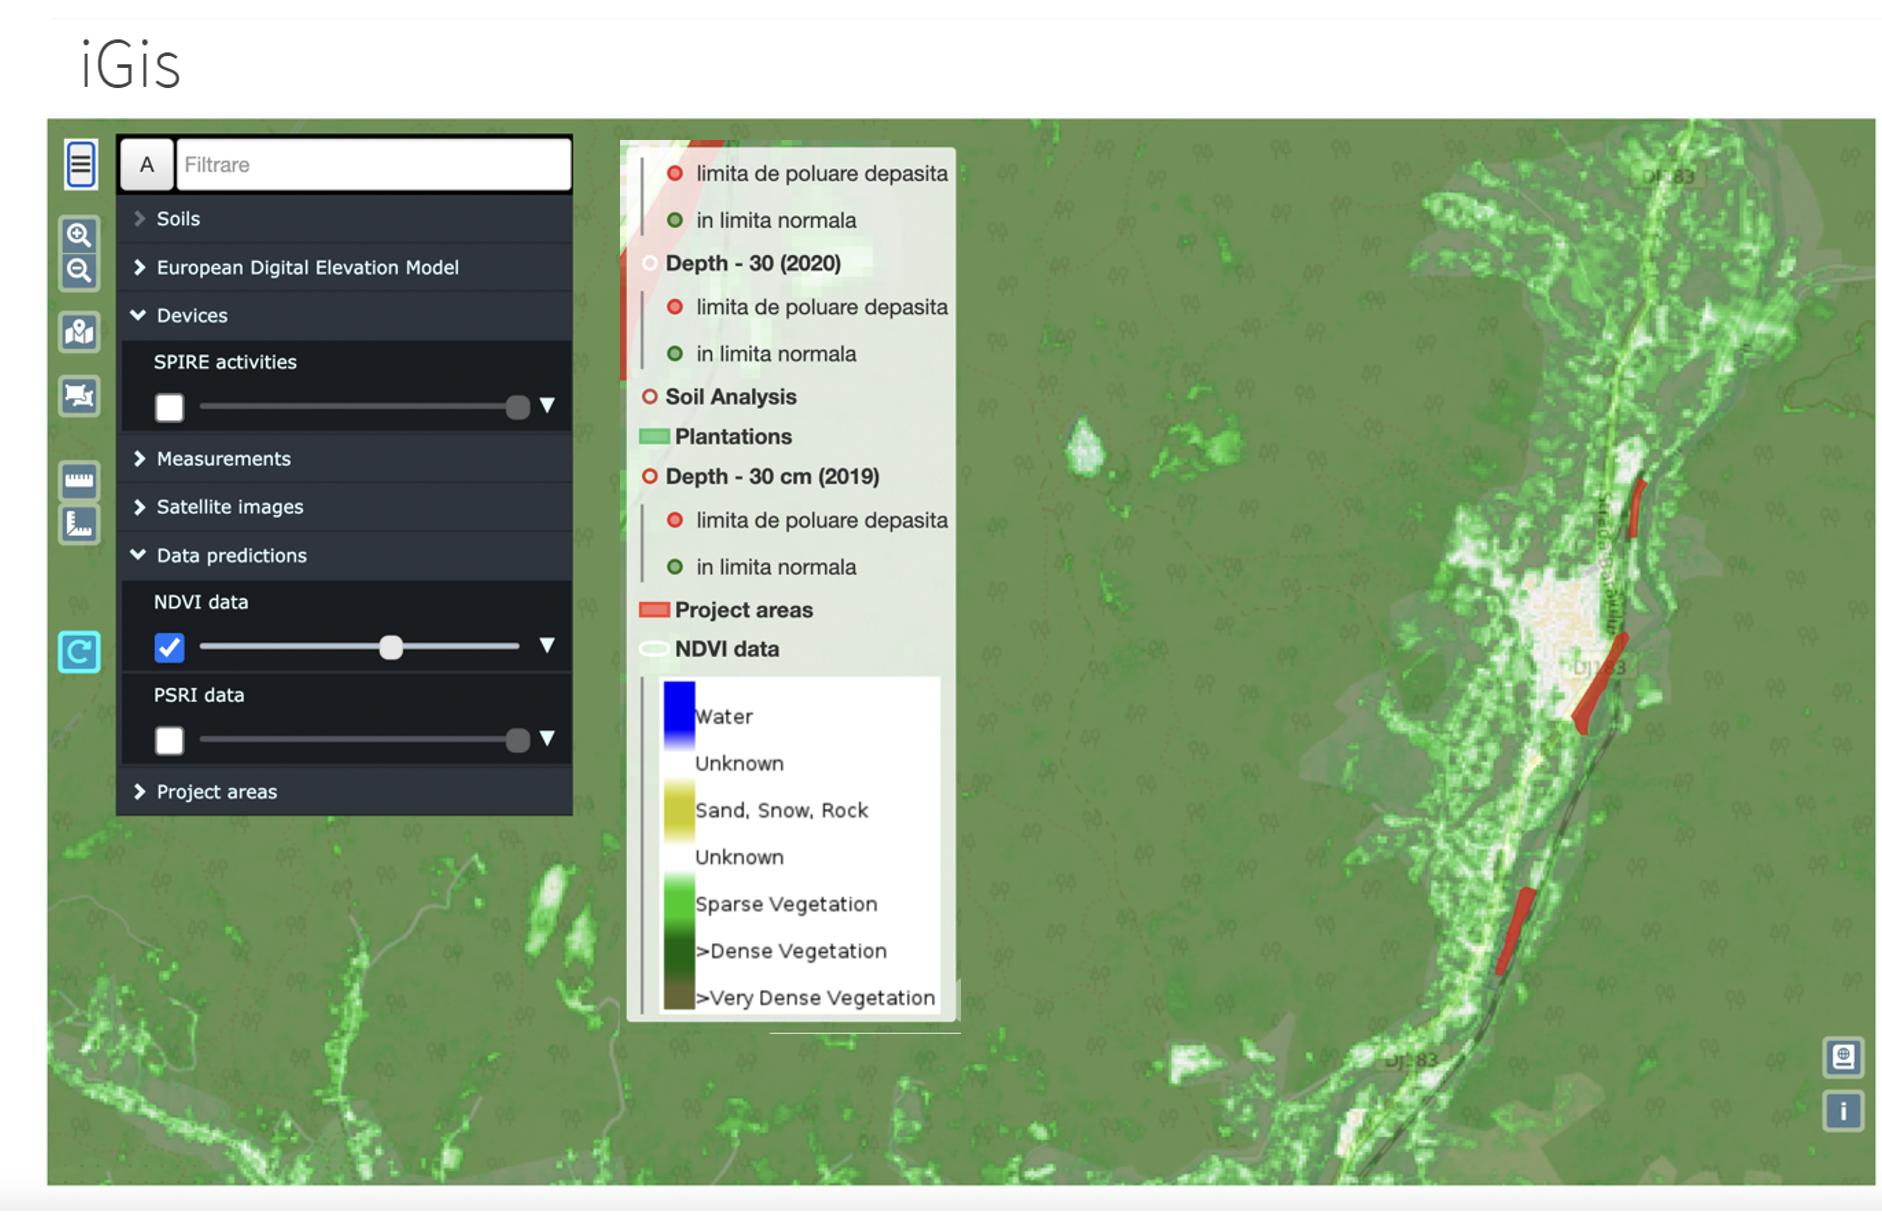 Fig. 6: Data predictions. NDVI. Source: SPIRE project
In the SPIRE project, Predictive analysis of sites and the city area has already been put in place for 2 satellite indices (NDVI and PSRI), the rest being in progress. As more data will be ingested regarding ground measurements (after several plantations), predictive algorithms will also be fine-tuned for that data.
Presenting data
Accessing data from GIS brings unforeseen opportunities. It allows us to visualize the world realistically; and at the same time demonstrate additional and/or derived data in an amplified virtual reality. The challenge is representing a 3D world on a 2-dimensional map.
Map markers, density, and colour-coded maps represent data and indicators that reveal counter-intuitive correlations and patterns. Icons offer users to manage the map and look at the information from different perspectives. The geographical, built, social and economic features allow prognosis solutions and monitor potential changes and their impact. Chart comparisons between different measurements show the complexity of historically polluted sites, as pollutants values differ even within the same site or in close vicinity.
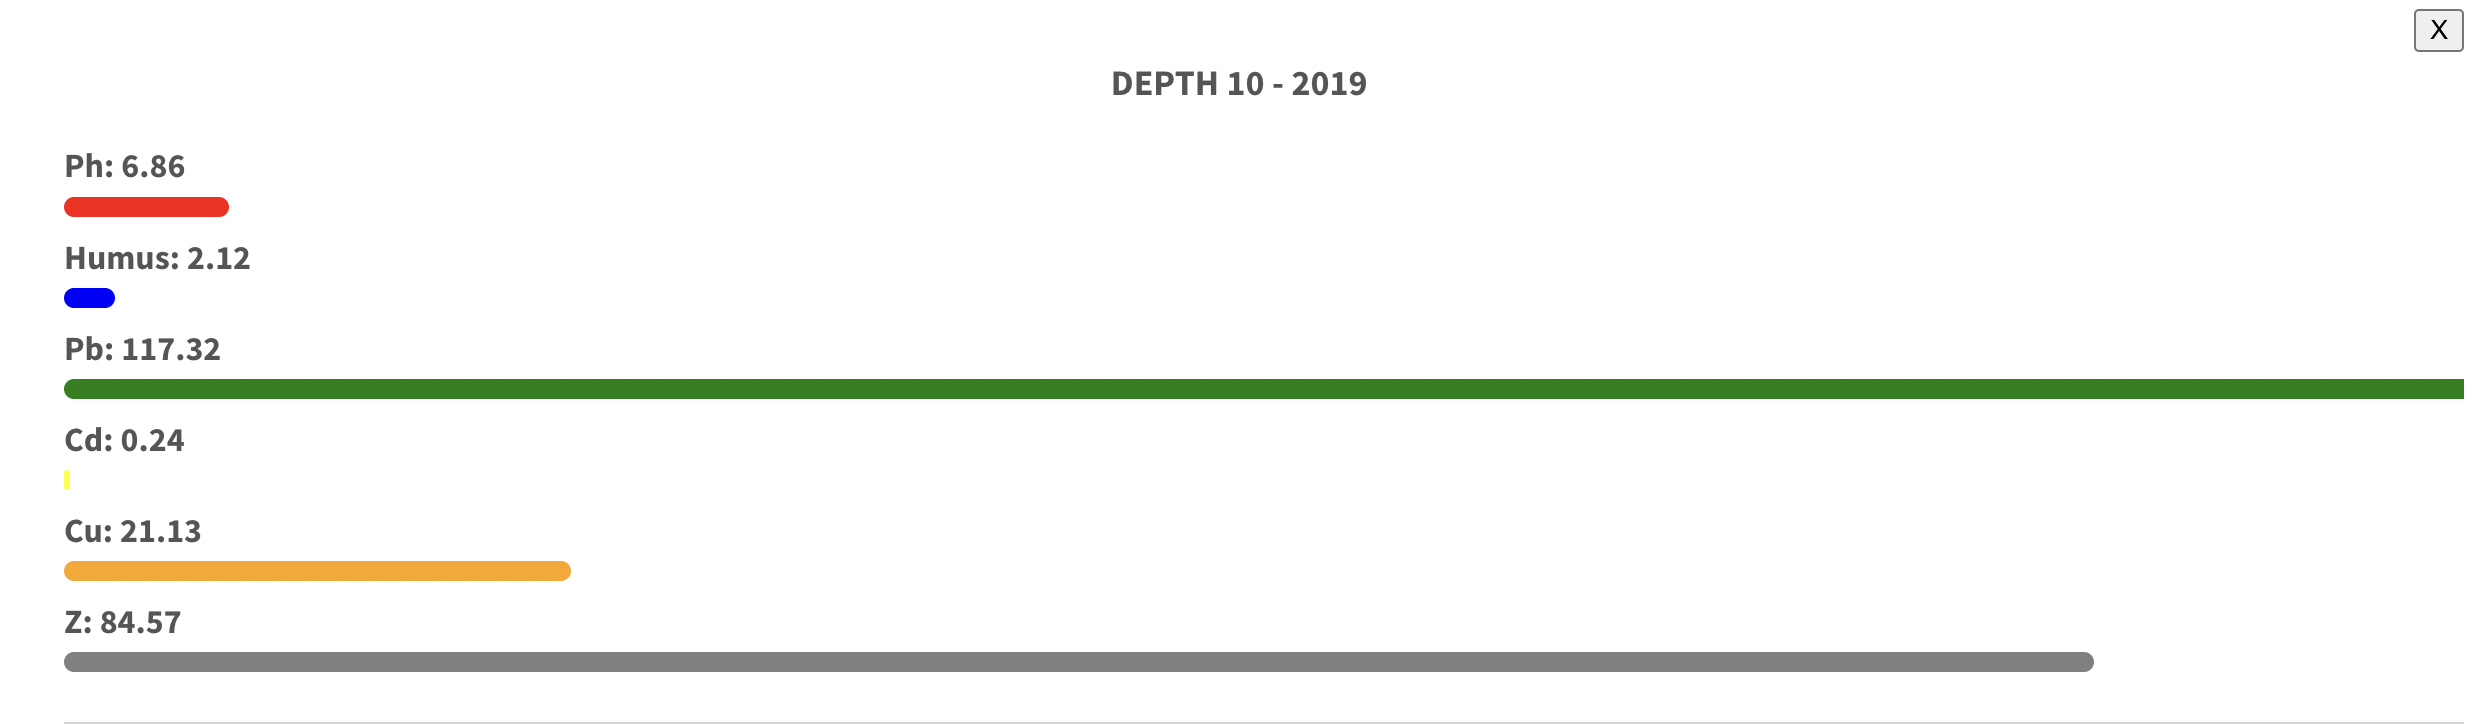 Fig. 7: Data about soil in Colonia Topitorilor pilot site. Source: SPIRE project
In the SPIRE project, the interface displays a customizable view tailored to collect, revise; and show information about phytoremediation and plantation processes in the city. It will also embed information on the future Baia Mare Metropolitan Plan 2050.
Information regarding plantathlons and landscaping is being added continuously to the platform to provide a comprehensive image of the SPIRE efforts and benefits to the community.
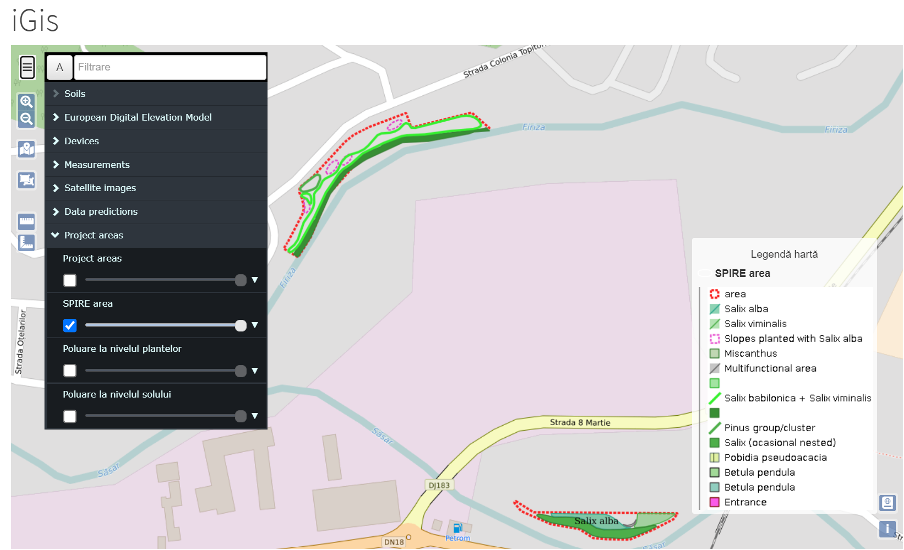 Fig. 8: Plantathlons and plantation areas. Source: SPIRE project
With solid consideration for general Data Protection Regulation (GDPR) compliance, data regarding iLEU user mobility trails are visible within iGIS, supporting identifying and creating bike and pedestrian lanes within the city.
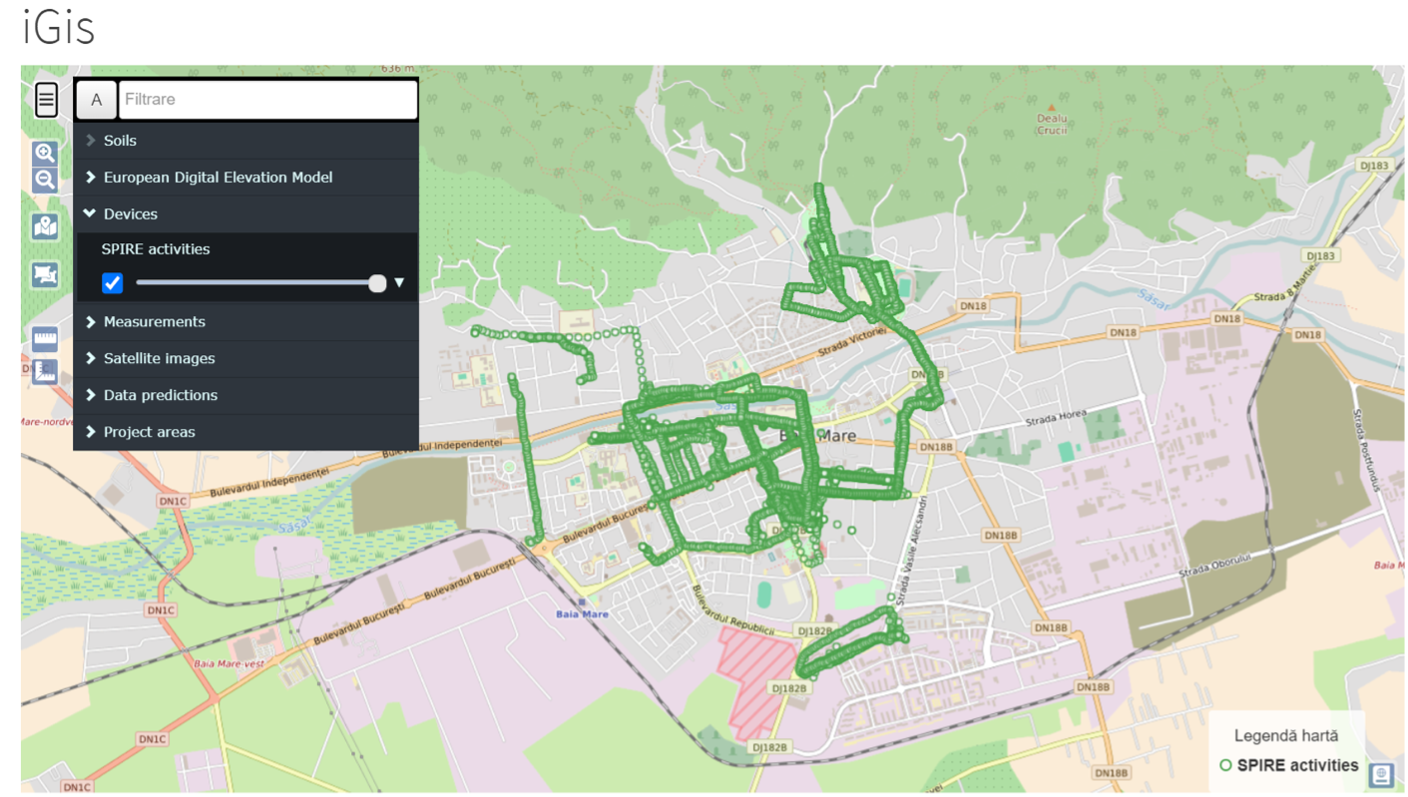 Fig. 9: ILEU data related to bike and pedestrian lanes. Source: SPIRE project
iGIS tool in Baia Mare is used for education, gamification, assessment, and measuring the SPIRE project Key Performance Indicators. The platform provides a complete overview of the intervention areas and simulations of the impact of replication in different areas using Artificial Intelligence. Multimedia tools will enable visualization for students and local stakeholders, enabling them to simulate the effects of actions and understand specific NBS and processes.
SPIRE advances this way in NBS geographical analysis, monitoring, and evaluation while also working on the next steps. The indicators are designed from a deductive vocation extracting data from the past while leveraging an inductive domain that anticipates and establishes potential future pathways on critical issues. NBS and phytoremediation's actual impact on the pilot sites can be tested, as well as the possibilities of the biomass derived from these processes to generate new materials and biofuels, providing evidence for policy and decision-making that will ultimately facilitate urban interventions and lessons learned.
All vectorial data obtained within the project is open-data, downloadable, and freely usable, both in geospatial (.shp) and text (.csv) formats.
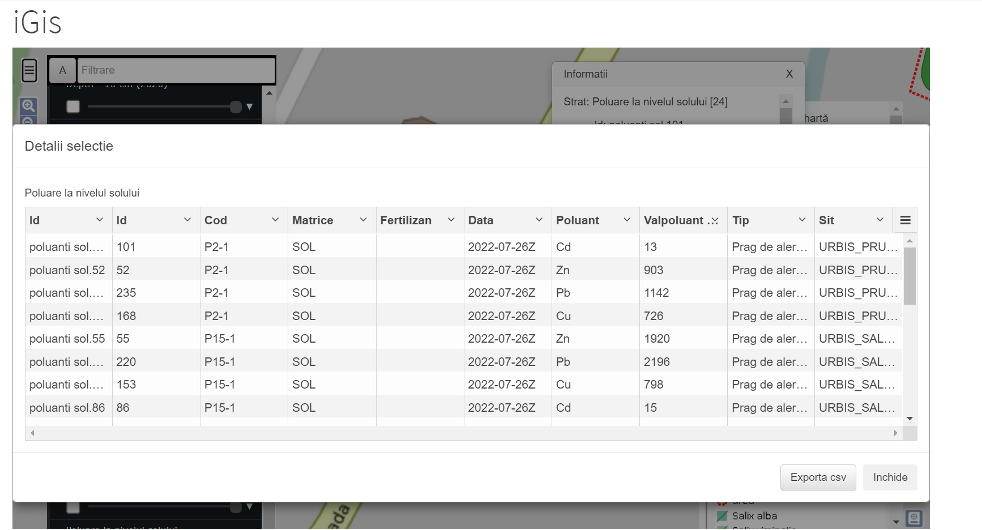 Fig. 10: SPIRE iGIS open data. Source: SPIRE project
Aspectum (2020) GIS Data and How to Present it on Maps. Available at: https://aspectum.com/gis-data-and-how-to-present-it-on-maps/
Celaya Alvarez A. (2021). Re-naturing cities through phytoremediation: How Nature Based Solutions can make a difference. Available at: https://uia-initiative.eu/en/news/renaturing-cities-through-phytoremediation-how-nature-based-solutions-can-make-difference
Celaya Alvarez A. (2021). Resilient cities after COVID-19: the need for green infrastructure. Available at: https://uia-initiative.eu/en/news/resilient-cities-after-covid19-need-green-infrastructure
Celaya Alvarez A. (2020) Creating new social and economic value: Restoring the urban ecosystem. Available at: https://uia-initiative.eu/en/news/creating-newsocial-and-economic-value-restoring-urban-ecosystem
Celaya Alvarez A. (2020) Urban soil decontamination for citizens’ health. Available at: https://uia-initiative.eu/en/news/urban-soil-decontamination-citizens-health
Celaya Alvarez A. (2020) SPIRE Zoom In: Plantathlon and Phytoremediation in BaiaMare. Available at: https://www.uia-initiative.eu/en/news/spire-zoom-plantathlon-and-phytoremediation-baia-mare
Celaya Alvarez A (2015). Scope and limitations of indicators related to disaster risk reduction in urban settings: towards an urban resilience model [Master’s thesis]. Bilbao and Brussels: Network on Humanitarian Action Master, Deusto University and NOHA Network.
Coman et al., (2010). Heavy Metal Soil Pollution - Specific issues for Baia Mare area, Available at: http://journals.usamvcluj.ro/index.php/promediu/article/view/4833
Coman M. (2016). Depresiunea Baia Mare: protecţia mediului din perspectiva dezvoltării durabile. protecția mediului din perspectiva dezvoltării durabile. Available at: http://ebibliophil.ro/carte/depresiunea-baia-mare-protectia-mediului-din-perspectiva-dezvoltarii-durabile
EC (2022) Copernicus. Available at: https://www.copernicus.eu/es/sobre-copernicus
EC (2017). Nature based solutions. Available at: https://ec.europa.eu/info/research-and-innovation/research-area/environment/nature-based-solutions_en
EC Environment (2019). Ecosystem services and Green Infrastructure. Available at: https://ec.europa.eu/environment/nature/ecosystems/index_en.htm
Leopa, S. (2020). Standards and Key Performance Indicators for Smart Post-Industrial Regenerative Ecosystems. SPIRE - Smart Post-Industrial Regenerative Ecosystem, Technical Report D4.3.2, DOI: 10.13140/RG.2.2.33583.56481(D.4.3.2, Standards and Key Performance Indicators for Smart Post-Industrial Regenerative Ecosystems)
L3Harris (2022) Dry or Senescent Carbon. Available at: https://www.l3harrisgeospatial.com/docs/drysenescentcarbon.html
London School of Economics and Political Science (2017) Urban Uncertainty
Governing cities in turbulent times. Available at:https://www.lse.ac.uk/cities/publications/research-reports/Urban-Uncertainty
Observatorio de tecnologías (2016). Sistemas de Información geoespacial. Available at: https://perio.unlp.edu.ar/sitios/observatoriodetecnologias/sistemas-de-informacion-geoespacial/
Pop Sorin (2020) GIS platform (D 5.1.1. GIS platform)
UIZ (2019) The Process of Data Collection in GIS. Available at: https://uizentrum.de/the-process-of-data-collection-in-gis/?lang=en
SPIRE project (2020). Available at: http://spire.city
About this resource


The Urban Innovative Actions (UIA) is a European Union initiative that provided funding to urban areas across Europe to test new and unproven solutions to urban challenges. The initiative had a total ERDF budget of €372 million for 2014-2020.

Similar content