Indicators as tools for Adaptation to Climate Change at the city scale - The Climate Shelters project of the City of Barcelona

Indicators at the city scale are tools that allow policymakers, city officials and city planners to monitor and analyze the environmental, climatic and socio-economic impact of urban policies and projects.
They allow the detection of problems, the identification of risks and the assessment of the progress towards reaching targets. To this end, they support the drafting of environmental and climate adaptation measures as well as the monitoring of their effectiveness.
According to the European Environment Agency (https://www.eea.europa.eu/data-and-maps/indicators/about), indicators fall under the following categories (Figure 1):

Figure 1. Categories of indicators.
The use of Indicators in the Climate Shelters project
In the event of heat waves, citizens need to have access to open air spaces acting as “cool islands”, i.e. spaces where thermal comfort is improved as compared to the local built environment. Through a project funded by the Urban Innovation Actions of the European Commission, the City of Barcelona turned through carefully selected interventions, eleven (11) school yards to “cool islands”, termed as, open to public, Climate Shelters.
In order to monitor the progress of the Climate Shelters project, a set of Performance Indicators (also termed as Result Indicators) was developed to address four main questions (Figure 2):

Figure 2. Questions addressed by the Climate Shelters Performance Indicators.
In order to capture the best available information and thus facilitate the early and reliable extraction of information, the Climate Shelters Performance Indicators were divided into eight distinct Sets (see also Figure 3):
- Performance Set 1: Adaptation to Climate Change
- Performance Set 2: Healthy, playful and inclusive schools
- Performance Set 3: Climate Justice
- Performance Set 4: Coherent community
- Performance Set 5: Conscientious and responsible citizens for Climate Change
- Performance Set 6: Efficient and Sustainable City
- Performance Set 7: Upscaling of the project
- Performance Set 8: Replication potential
Each set, and all sets together, support the assessment of the impact of the Climate Shelters project in terms of: the adaptation of schools to climate change, the inclusiveness of schools, the promotion of climate justice, the social coherence of neighborhoods, the success in introducing nature based solutions into the city, the awareness of pupils and teachers on climate change and finally the upscaling and replication potential of the project.

Figure 3. The sets of Indicators of the Climate Shelters project.
Some of the indicators are quantitative and require periodic measurements; others are qualitative and aim to capture perceptions, feelings and sentiments. Each indicator relates to a result and is described on the basis of three main questions: What is measured (including the units), how it is measured and how often it is measured. To this end, for each Result indicator, three values are provided: the baseline value, the value referring to what has been achieved at some stage of the project and the target value (Table 1).
Table 1. Requirements per Performance indicator.
|
Name of the result indicator |
Description of the result indicator |
Baseline |
Achieved so far |
Target value |
|
|
The description shall clearly specify: 1.What is measured (number of people, kg, CO2 emissions, etc.) and the unit of measurement (e.g. in %, in °C…) 2.How is it measured 3.Frequency of update/ follow-up of the indicator |
The description shall clearly specify the initial value of the performance indicator before the project implementation |
The value of the indicator at the end of the reporting period |
The expected performance indicator’s value at the end of the project implementation |
The Performance Indicators currently in use for the Climate Shelters project need not be considered as final; additions or removals of indicators may apply in the course of the project, depending on aspects of the project to be also monitored or following the assessment of the potential of each indicator to capture the anticipated result. The sets of Performance Indicators are presented in Table 2 along with their description.
Table 2. Name and description of Performance Indicators per set.
|
Set of indicators |
Description of the set |
Name of the Performance indicator |
|
1. Adaptation to climate change |
Refers to indicators which capture the performance of interventions aimed at improving the local microclimate
|
1.1 Increased share of green surfaces in pilot schools (in %) |
|
1.2 Increased surface of shaded areas in pilot schools courtyards, sand boxes and sportive areas (in %) |
||
|
1.3 Decreased exposure to solar radiation of the pilot schools facade and schoolyards |
||
|
1.4. Decreased average temperature in the pilot schools |
||
|
1.5. Increased water in schoolyards |
|
2 Healthy, playful and inclusive schools |
Refers to health related indicators |
2.1. Decreased number of health incidences because of heat
|
|
2.2. Improved self-perceived thermal comfort among pupils and educational community |
||
|
2.3. Reduced CO2 in the pilot schools classrooms |
||
|
2.4 Decreased Particulate Matter (PM) in the pilot schools classrooms |
||
|
2.5. Increased nature relatedness by the pilot schools users |
||
|
2.6. Increased pupils’ physical activity resulting from the improved thermal comfort in the pilot schools |
||
|
2.7 Increased level of pupils’ attention during courses resulting from the improved thermal comfort and the decrease of CO2 in the pilot schools’ classrooms |
||
|
2.8. Increased users’ physical and mental well-being resulting from the improved environment in pilot schools |
|
3 Climate Justice |
Refers to indicators improving the quality of life |
3.1 Decreased number of days T> 26 ºC inside the classrooms. |
|
3.2 Number of users of the pilot schools, transformed into climate shelters, during a heat wave incident |
|
4 Coherent community |
Refers to indicators which may reflect cohesion of the local community |
4.1 Increased number of Open Courtyards users |
|
4.2 Increased inter-generational diversity among the open courtyards users – Share of youngsters, adults and elderly |
|
5 Conscientious and responsible citizens for Climate Change |
Refers to indicators which show the awareness of citizens |
5.1 Increased conscientiousness and awareness about Climate Change among citizens (pupils, families) as a result of the pedagogical and participatory processes.
|
|
5.2 Increased conscientiousness and awareness about Climate Change among the educational community as a result of the pedagogical and participatory processes |
|
6 Efficient and Sustainable City |
Refers to indicators which are related to sustainability at the school scale |
6.1 Solar energy produced in pilot schools |
|
6.2 Quantity of water used or reused for irrigation in pilot schools |
||
|
6.3 Increased energy efficiency of the pilot schools buildings |
|
7 Upscaling of the project |
Refers to indicators which show the potential for the expansion of the schools to become Climate Shelters |
7.1 Political commitment to adapt more schools than the 11 pilot schools after the closure of the project |
|
7.2 Additional resources available for adapting schools to climate change, besides the 11 pilot schools of the project |
||
|
7.3 Number of schools to be adapted to Climate change for scaling-up the solution following the end of the UIA project |
|
8 Replication potential |
Refers to indicators which show the replication potential of the project |
8.1 Number of interested cities |
|
8.2 Number of cities to promote the solution to other cities |
As described earlier (see Table 1), for each Performance Indicator, a description needs to be provided along with the reasoning for its selection. Some indicative cases follow (Table 3).
Table 3. Indicative examples of Performance Indicators along with their description and reasoning.
|
Set |
Indicator |
Desciption and reasoning |
|
Adaptation to Climate Change
|
Increased share of green surfaces in pilot schools (in %) |
The amount of greenery (%); estimated by comparing the size of the areas covered with permeable surfaces (in m2) to the size of the area covered with impermeable surfaces (m2). It supports the understanding of the impact of green solutions to the state of the thermal environment through evapo-transpiration. Provides a view on the degree of green adaptation. |
|
Healthy, playful and inclusive schools |
Reduced CO2 mixing ratio at pilot schools' classrooms |
Reduced CO2 mixing ratio in parts per million (ppm). It is important for assessing the quality of indoor air as well as to interpret the pupils’ level of attention. |
|
Coherent Community |
Increased number of Open Courtyards users |
Increase of the number of people using the open courtyards. It reflects the improved attractiveness of the open courtyards and supports cohesion at the local scale. |
|
Efficient and Sustainable City |
Energy consumption of the pilot schools' buildings |
The amount of KWh consumed per school per month. It demonstrates the effectiveness of measures such as insulation, shading, greening, ventilation, etc. |
Supporting the overall city effort
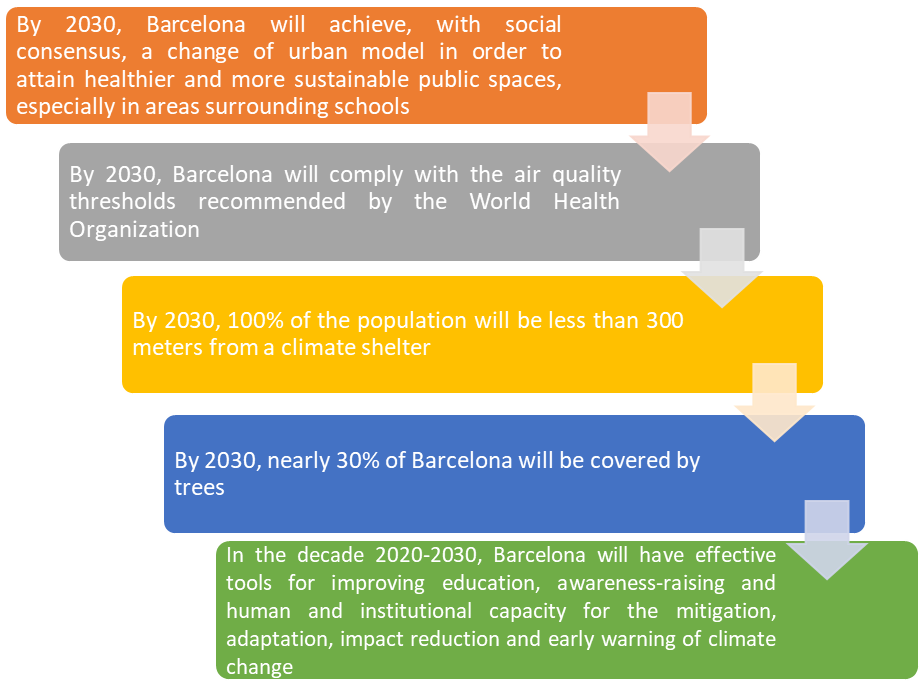
The use of the sets of Performance Indicators as developed for the Climate Shelters project, is also considered supportive for the assessment of the overall effort of the City of Barcelona to adapt to climate change. This is particularly the case for the following targets as set in the document “Barcelona’s 2030 Agenda. SDG targets and key indicators” (Barcelona City Council, 2020).
Some final words for consideration
Although the use of indicators is a well-established process, a number of issues need to be considered:
1/ Without good (temporal and spatial) data based on monitoring, it is rather impossible to develop indicators.
2/ Indicators need to be flexible, in the sense that there may need to evolve over time to capture new needs and challenges.
3/ Composite indicators (namely the synthesis of individual ones) may support specialized knowledge on an issue (for instance the combined use of indicators on temperature and humidity, may support the extraction of an indicator on thermal comfort).
4/ Indicators tends to reduce uncertainty, yet they do not eliminate it.
5) An additional challenge is to develop and preserve a data repository so as indicators to be estimated without gaps and on the basis of real data.
About this resource


The Urban Innovative Actions (UIA) is a European Union initiative that provided funding to urban areas across Europe to test new and unproven solutions to urban challenges. The initiative had a total ERDF budget of €372 million for 2014-2020.

Similar content