Diesel generators are the main source of environmental pollution in events. In fact, mitigating their effects is the raison d'être of the AIRQON project. But the question is, to what extent do emissions from this equipment impact air quality? And knowing that events are generally outdoor activities, is this impact significant under these conditions? Or is this a matter related to subjective perception?
Text
To give scientific answers on this, the Institute for Risk Assessment Sciences (IRAS) of the Utrecht University, in collaboration with ZAP concepts and Kairos Events, works in AIRQON on air quality impact assessment and public awareness. On the one hand, IRAS brings a wide knowledge on the fields of environment and pollution; on the other hand, ZAP concepts and Kairos Events provide their expertise on energy planning and event promotion, respectively. In this way, and thanks to this combination of capabilities, tests and measurement campaigns have been conveniently designed according to the real conditions of events, so the impact of diesel generators can be properly quantified and assessed.
QUOTE
Title
Air quality impact
Text
“Assessing the air quality impact of diesel generators at events is complicated because air quality levels of relevant pollutants are affected by background pollution from other sources, such as industry and road traffic, and also, very importantly, by weather conditions. Furthermore, at events there are typically other combustion sources, such as smoking of visitors and food preparation. A careful design is therefore needed”
Text
Analysis is focused on the main categories of air quality pollutants emitted by diesel generators: fine dust (also known as PM2.5), soot (masses of impure carbon particles resulting from the incomplete combustion of hydrocarbons), and ultrafine dust (also known as Ultrafine Particles, UFP). In addition to this, noise levels are assessed as another impacting effect of diesel-powered engines.
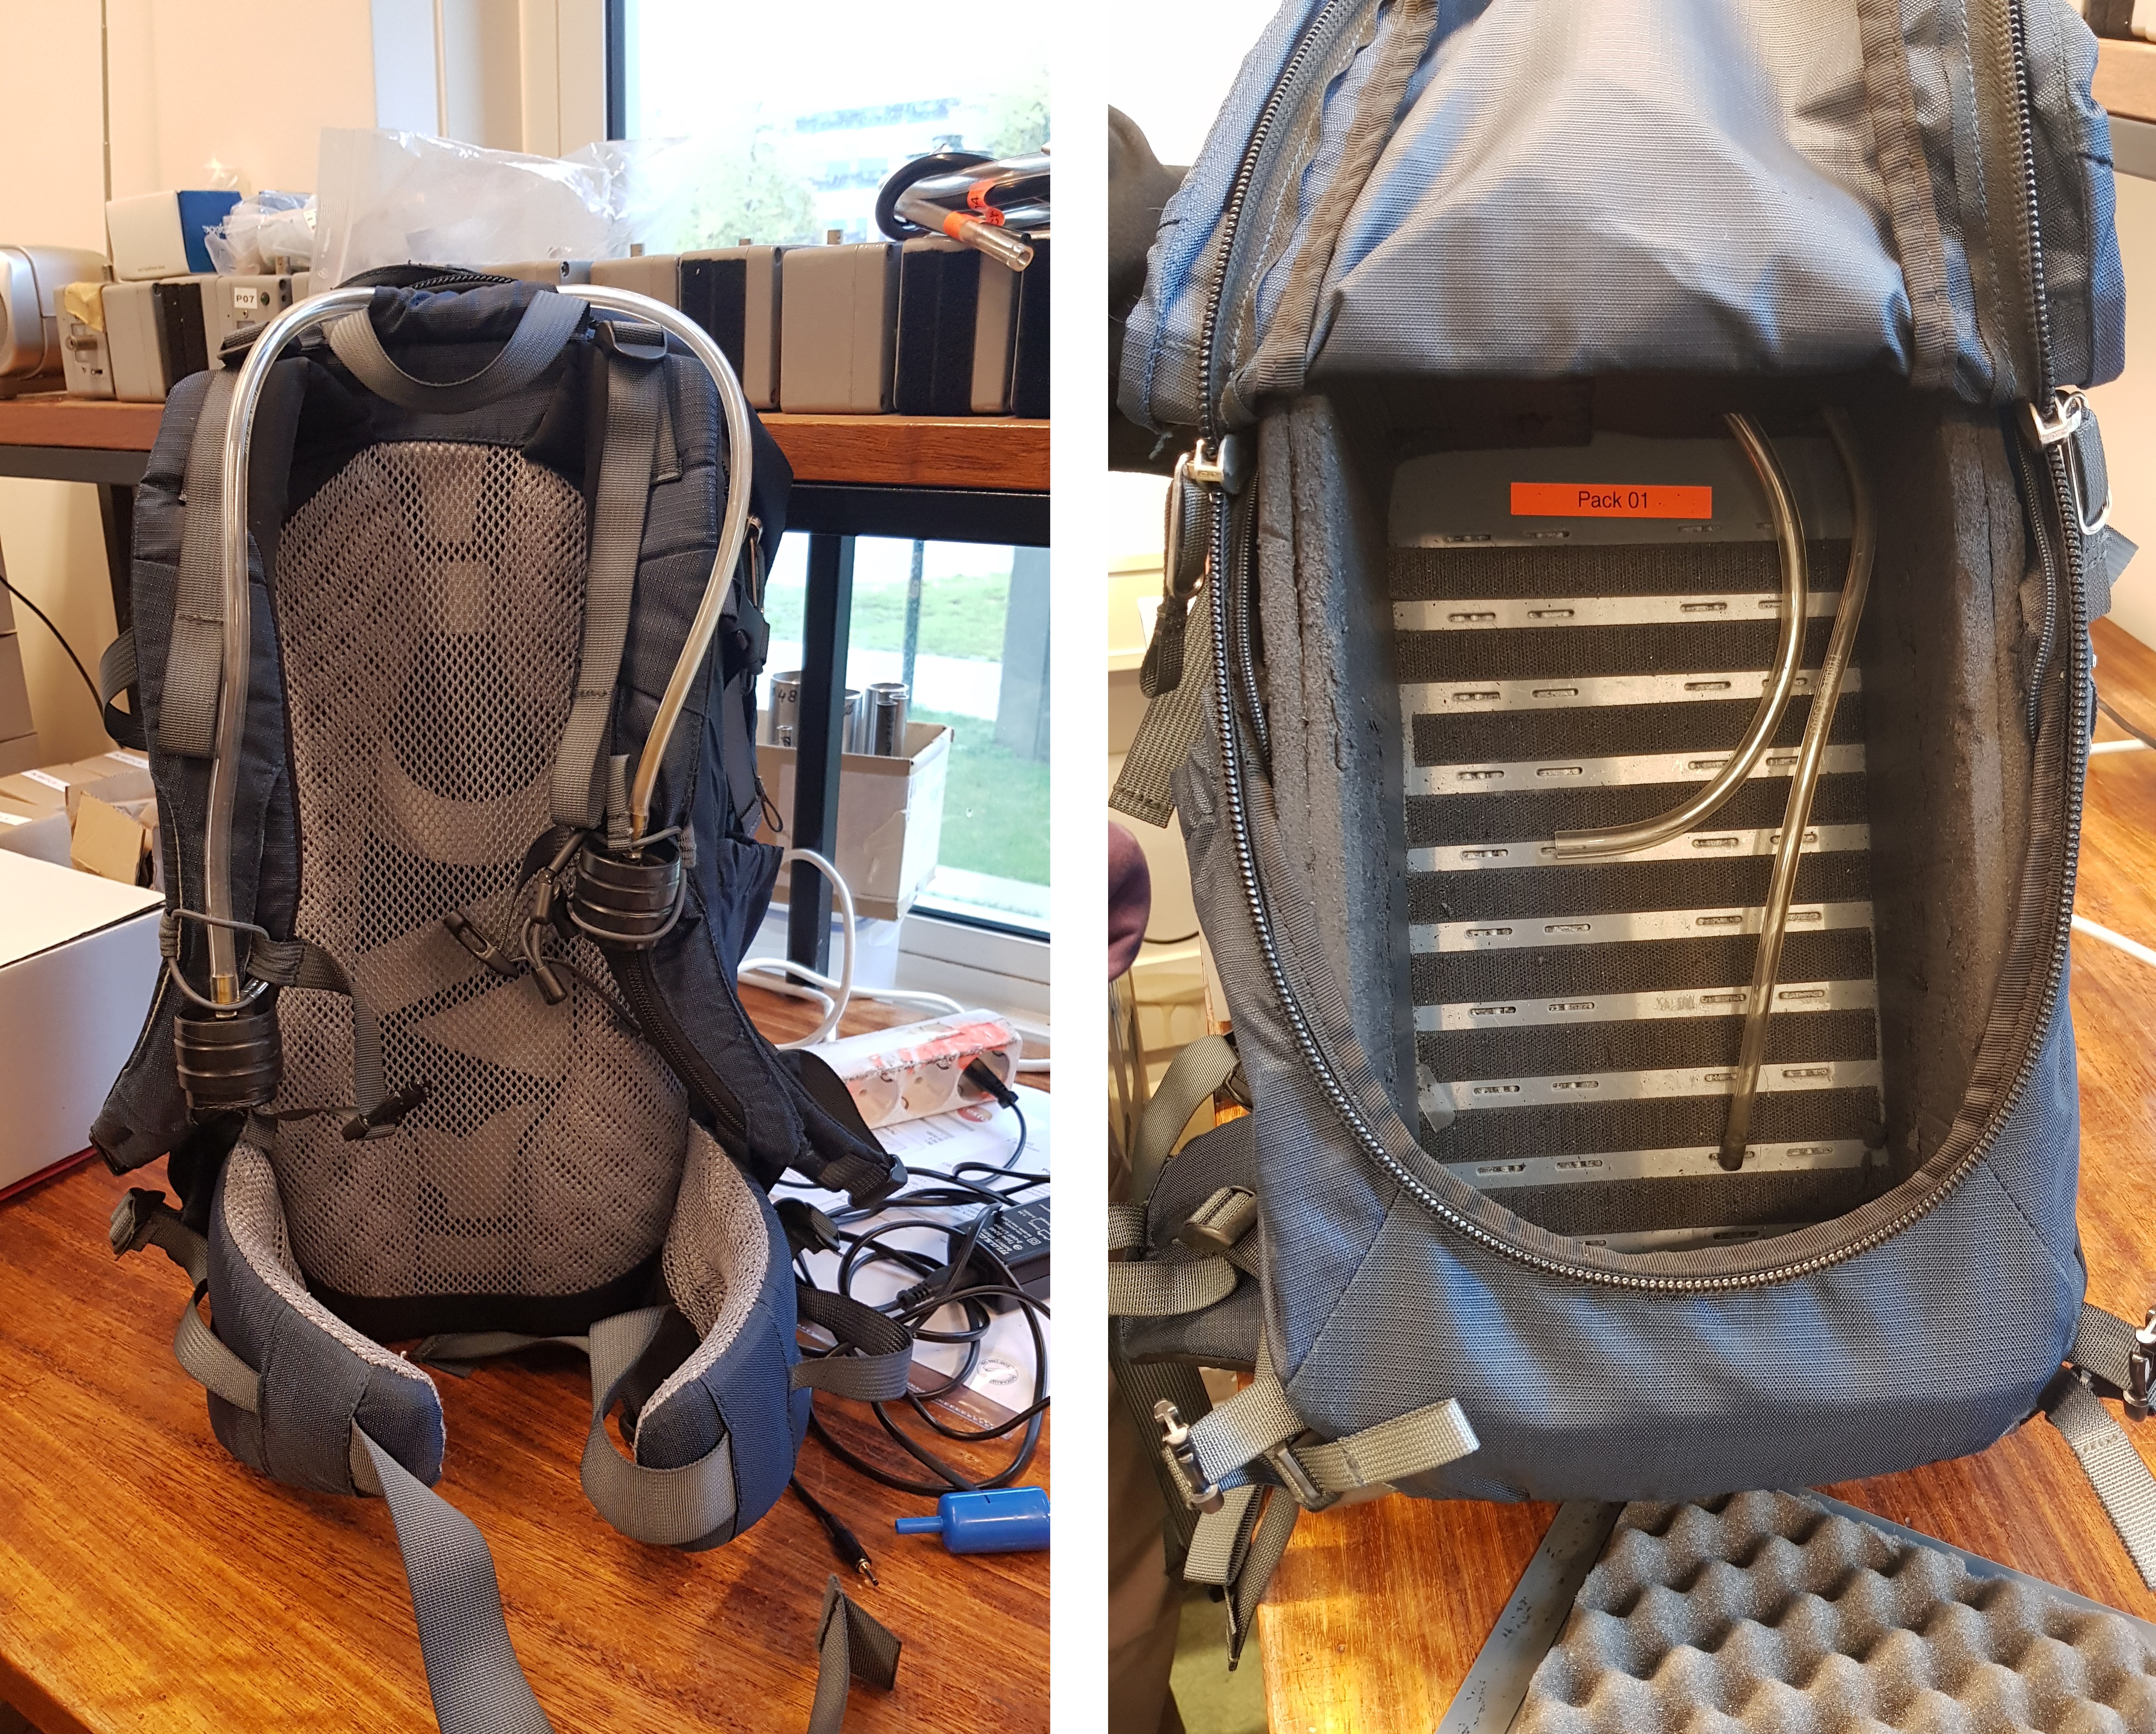
Backpack measurement equipment
Measurements are done by means of 4 backpack kits. These backpacks are common sports equipment but have been modified to carry comfortably all the necessary metering devices. Each backpack kit is equipped with 3 different meters: the Sidepak, to measure fine dust concentrations; the MA200 Aethalometer, for soot; and the Diskmini, for ultrafine dust. Each kit is also equipped with 3 GPS devices to provide redundancy and accuracy in the geographical positioning along the data acquisition process. Then, it is possible to correlate air quality and geographical data with the aim of performing the necessary impact assessment. For example, this allows to consider the distance between every backpack (and their metering devices) and the source of pollutant emission, which can be a critical aspect to be considered in the analysis of results.
Backpack measurement kit
Data sampling rate used in the data acquisition process is 1 second and each backpack measurement kit has at least six hours operating autonomy. It must be noted that the inlet of the measurement sensors is located in the backpack straps near to the position of the mouth of the person carrying it. The purpose is to clearly reflect the effects perceived by a person in real conditions. Once backpacks are ready, the measurement campaign can start!
Living lab set up
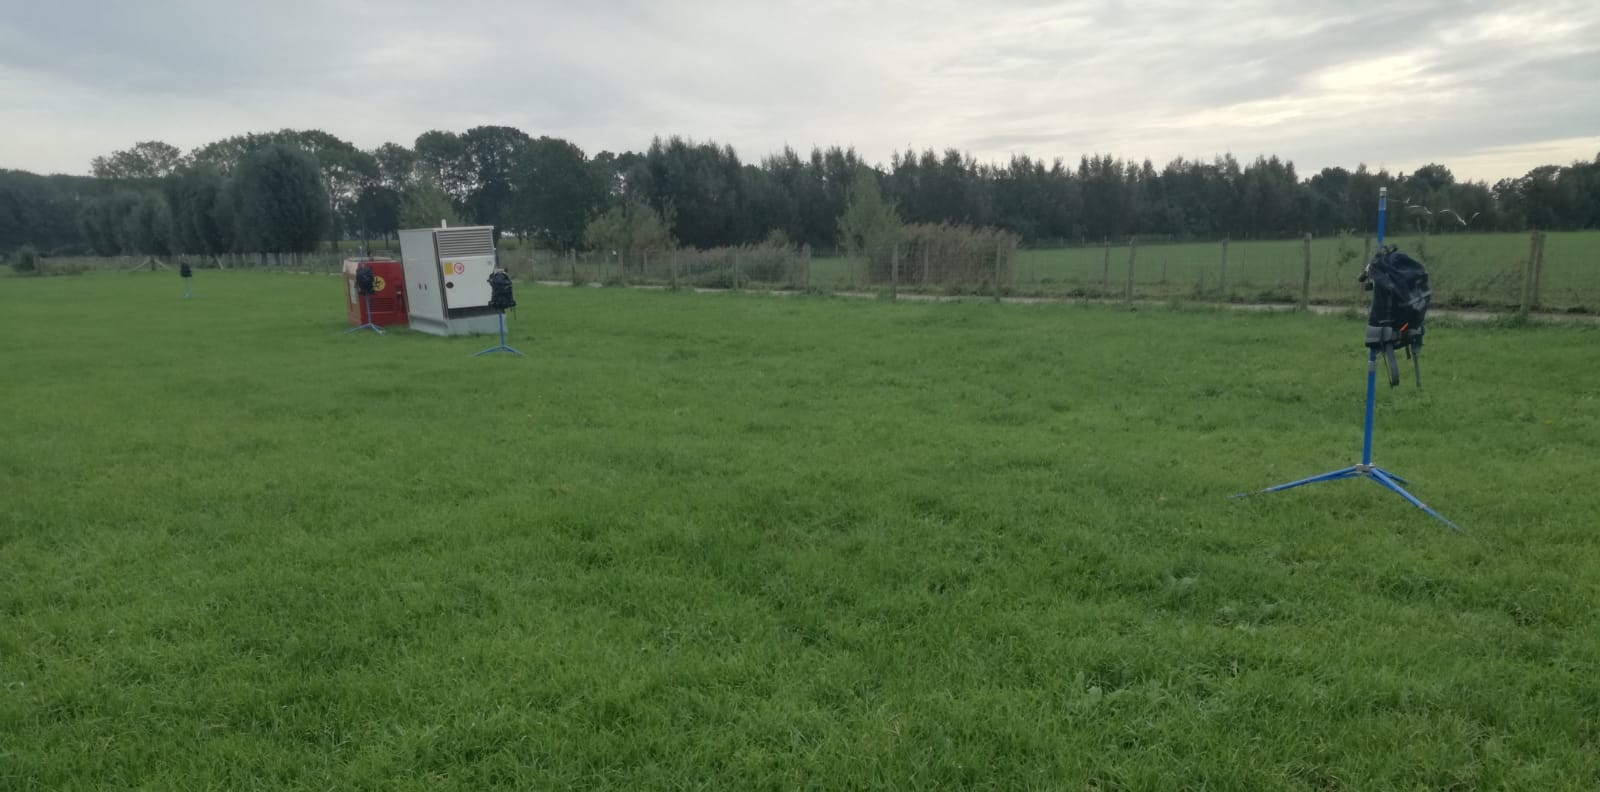
Two of the most common configurations of diesel generators for events have been used in the living lab measurement campaign: a 100 kVA capacity diesel generator, which corresponds to a medium-sized power source, and a 15 kVA capacity diesel generator, which is a small-sized one. These two types of generators are very representative because events normally are powered by using those capacities, or an aggregation of several units of those sizes. Hence, the analysis of results obtained will reflect the effective impact, and appropriate extrapolations could be done on this basis.
Backpack measurement kit situated at a certain distance from the emitting source during the measurement campaign
Measurements were made by locating backpack kits at different distances from the diesel generators, which are the pollutant emitting sources: 3 meters, 10 meters and 25 meters. In the case of 3-meter distance, it represents the effect typically perceived by staff that works in the event itself. 10 meters is the distance for people located nearby diesel generators, as in the case of a food court powered by this kind of generators, for example. And last, but not least, 25-meter distance reflects the effect perceived by any attendee to an event, not directly exposed to the emitting sources, as in the case of anyone in the dance areas or other open spaces like them.
This living lab measurement campaign took place outdoors on the premises of the Utrecht University, in an open space located far from strong polluting sources such as highways or industries. Data acquisition was carried out over 10 days in October 2020. Moreover, measurements were made in both downwind and windward directions with the aim of collecting data in any condition able to be experienced in an event. In other words, the impact is assessed considering that wind conditions can be favorable or not, hence mitigating or worsening background air quality conditions.
Moreover, measurements were made while the diesel generators were connected and in operation, but the background conditions were also measured having them disconnected. These background measurements allow to determine airborne pollutants and clearly evidence the direct impact due to diesel generators and their emissions.
Diesel generators were connected to loads that exactly replicated the demand of a typical event: lighting, sound, auxiliary equipment, etc. To do so, these devices have performed a characteristic load protocol that corresponds to a real event. This has been essential to reflect the real operation conditions of a diesel generator, instead of measuring emissions with stand-by generation regimes that would have resulted in unrepresentative data. In addition to this, there is a high influence on emissions of the state of health of diesel generators: cleanliness of filters, previous hours of operation, maintenance status, etc.
Data analysis
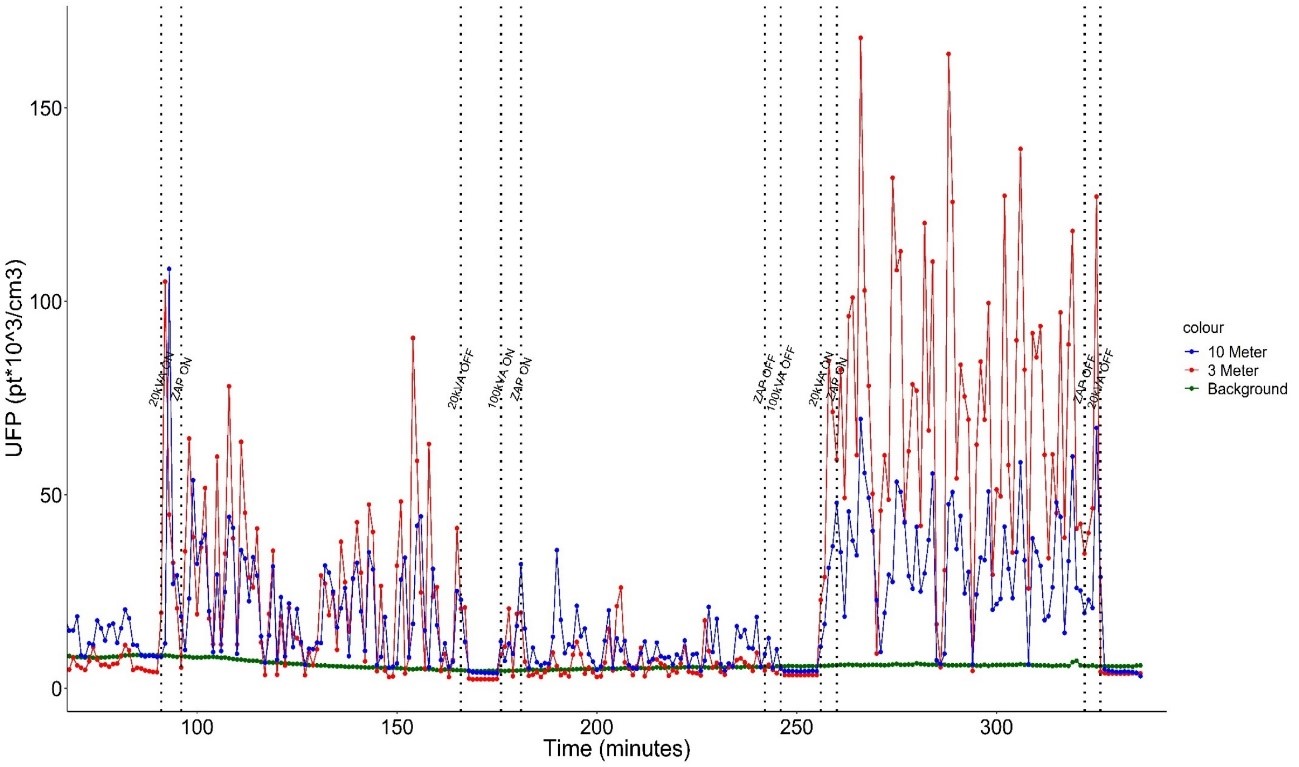
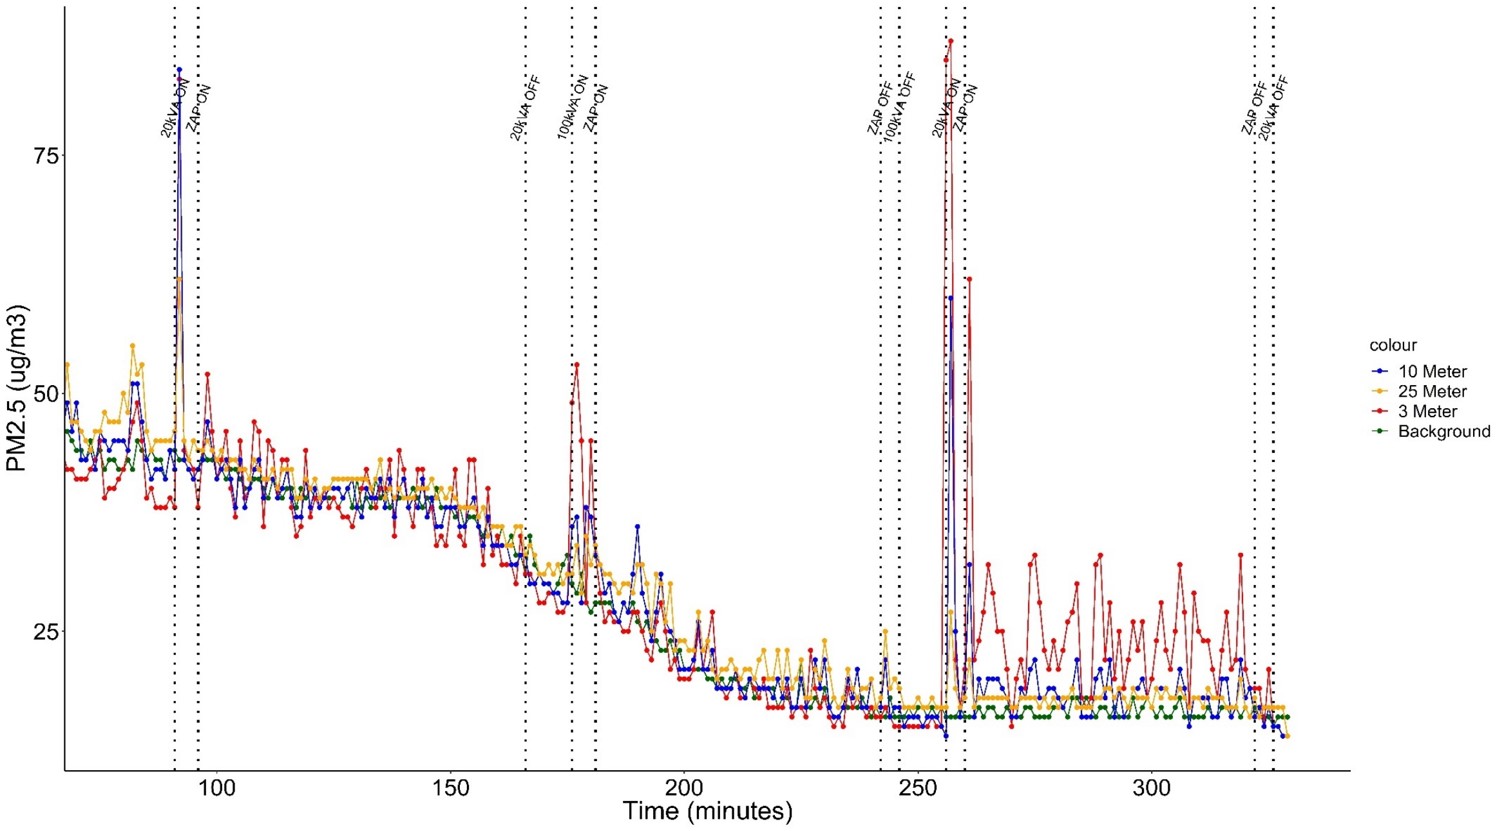
Pollutants have different presence in the air. At the same time, they are differently emitted by generators. On the one hand, UFP are low in the background air and remain fairly stable throughout the tests; this leads to an evident reflection in the graphs of the measurements obtained. On the other hand, PM2.5 are highly present as background concentrations in the air and are often transported over long distances; in this case, the direct impact due to diesel generators is not as evident as for UFP. Furthermore, there were noted significant changes in the presence of PM2.5 in the background air conditions throughout the tests.
Source: IRAS, Utrecht University. Example of 300-minute UFP emission measurements. Background air values (in green color) had almost no variations throughout the represented test period. However, emissions due to the two generators strongly stand out in the baseline. Emissions measured at 3 meters (red color) exceeded those measured at 10 meters (blue color). Besides this, different load regimes (activation/deactivations represented with vertical lines) determined the different levels of emissions measured: on the left side of the graph, emissions while the small generator is in operation; on the center, emissions using both the small and medium generator; on the right side, emissions using the medium generator
Throughout the whole test period, the presence of UFP due to the 15 kVA generator goes from 8,000 particles per cubic centimeter of air in the baseline scenario to 16,500 measured at 25 meters, 18,800 at 10 meters or 120,300 at 3 meters. However, the 100 kVA generator leads to lower values: from a baseline of 7,200 particles per cubic centimeter of air, to 13,000, 8,000 and 12,000 at 25 meters, 10,000 meters and 3 meters respectively. Therefore, in both cases emissions measured at a distance of 25 meters are twice those measured in the baseline scenario, what evidences the magnitude of the local impact of diesel-powered solutions.
Source: IRAS, Utrecht University. Example of 300-minute PM2.5 emission measurements. For the same sequence of activations/deactivations displayed for UFP measurements, the presence of PM2.5 can be reduced to less than half along 4 hours of sampling. Only in the case of the medium generator operating regime (right side of the graph) there is a clearly differentiated behavior in the emissions measured
The impact due to PM2.5 is lower. In the case of the 15 kVA generator, from 10 microgram per cubic meter of air in the baseline scenario, emissions raised to 12 microgram per cubic meter of air measured at 25 meters, 13 at 10 meters or 26 at 3 meters. In the case of the 100 kVA generator, emissions remained as well in the same order of magnitude: 21 microgram per cubic meter of air in the baseline scenario, 24 at 25 meters, 23 at 10 meters and 22 at 3 meters.
Soot concentration measurements showed a strong impact caused by the diesel generators. In the case of the 15 kVA generator, it went from a baseline of 0.4 microgram per cubic meter of air to 9.9 at a distance of 3 meters, which means multiplying it by 20. At 10 meters, the values were 8 times higher, reaching 2.9 microgram per cubic meter of air. And finally, the values doubled to 0.7 microgram per cubic meter of air at 25 meters. In the case of the 100 kVA generator, the values at 25 meters were three times higher than in the baseline scenario, going from 0.5 to 1.7 microgram per cubic meter of air.
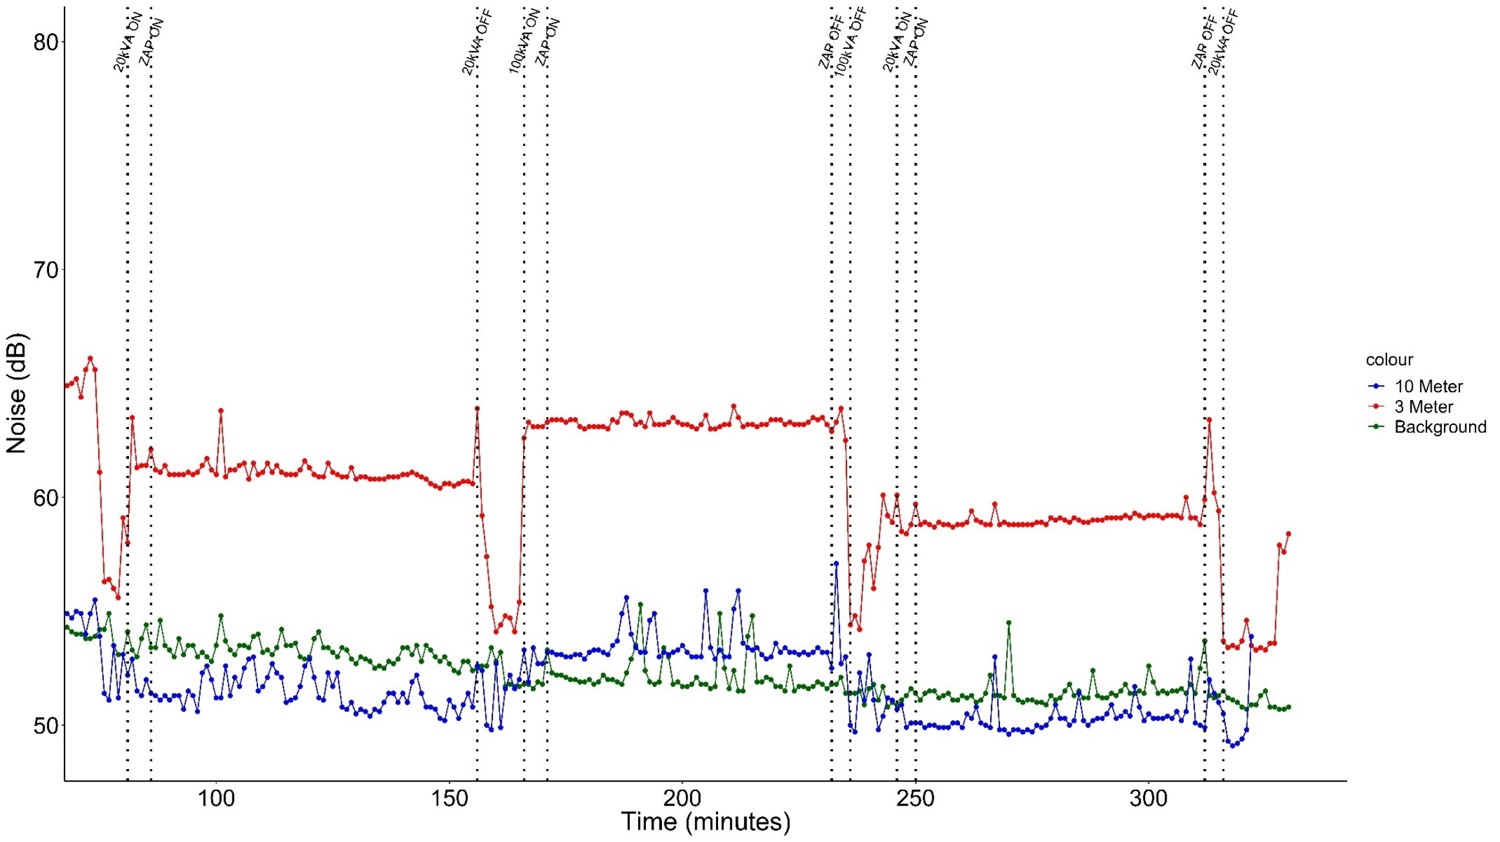
Source: IRAS, Utrecht University. Example of 300-minute noise emission measurements. For the same sequence of activations/deactivations displayed for UFP and PM2.5 measurements, the effect of noise can be almost negligible at 10 meters (in blue color)
The graph clearly shows again the diverse behavior experienced throughout the load protocol and the corresponding impact on environmental quality. When the 15 kVA generator is in operation, it goes from 54 dB baseline to 60 dB measured at 3 meters, although at 10 meters distance the effect is hardly noticeable. In the case of the 100 kVA generator, the effects are the same, going from 55 dB from the baseline to 66 dB at 3-meter distance, but almost negligible at 10 meters.
What’s next? Live festival measurements
Living lab tests help determine the impact due to diesel generators by clearly separating the influence of baseline airborne emissions. Having this, the event measurement campaign can be carried out to gather data during live festivals with thousands of attendees and multiple diesel generators. In particular, live festival measurements were made during Ploegendienst Summer Festival in 2019 and 2021, and the campaign will be completed with new measurements in 2022’s festival.
The measurement protocol begins with an a priori calibration of the 4 backpack kits in the laboratory. In addition to this initial set up, once the measurement ‘backpackers’ are in the event, they meet periodically in a certain geographical point. The objective of this is to make a calibration ‘on the go’, because this allows to check how pollutant concentration and GPS data of all the backpack kits are in the same order of magnitude, or to detect any deviation, for example.
During the data acquisition process the idea is that ‘backpackers’ move freely around the event, across the different areas, so a wide variety of situations are measured by each backpack measurement kit: close to the generators, nearby the food trucks and food courts, in the middle of the dance area, etc. because, of course, other externalities such as campfires, smoking or breathing count in the measurements made.
Furthermore, backpackers, sequentially, stand-by in areas situated away of the event epicentrum, so background measurements can be obtained as well. That is, one ‘backpacker’ stands while the other 3 are moving in the event, and then they switch the standing role periodically.
In the first years of the project, air quality measurements have been made while diesel generators were used to provide energy to the events. In 2022 measurements will be repeated when most energy is supplied by the AirQon solution, limiting the use of diesel generators, and even probably avoiding their use completely. By comparing results of these subsequent measurement plans, and integrating the living lab measurements as well, we will be able to characterize the gain in air quality by using a more sustainable energy solution. We will further link this to the perception of visitors and people living near major event sites.
About this resource
Author
Javier Leiva, UIA Expert
Project
AirQon - Air Quality through EV Battery Connectivity
Location
Breda,
Netherlands
Small sized cities (50k > 250k)
About
UIA
Urban Innovative Actions
Programme/Initiative
2014-2020
The Urban Innovative Actions (UIA) is a European Union initiative that provided funding to urban areas across Europe to test new and unproven solutions to urban challenges. The initiative had a total ERDF budget of €372 million for 2014-2020.