Evaluation - An indispensable component of innovation projects


Introduction
The Climate Shelters (GBG_A2CC) project of the City of Barcelona aims at the development of a network of Climate Shelters by converting schoolyards by means of blue, green, and grey interventions. The project supports the adaptation of Barcelona to climate change in terms of extreme temperatures and heatwaves.
The project also supports the implementation of the Sustainable Development Goals (SDG) of Barcelona as presented in the document “Barcelona: Sustainable Future (Barcelona Sustainable Future – Seventeen social, economic and environmental objectives; https://ajuntament.barcelona.cat/agenda2030/ca) namely:
SDG 13.1- By 2030, 100% of the population will be less than 300 meters from a climate shelter and with a water garden in every district.
SDG 13.3 – In the decade from 2020 to 2030, Barcelona will have effective tools for improving the education, awareness-raising, and human and institutional capacity for the mitigation, adaptation, impact reduction, and early warning of climate change.

The project is supported by the Urban Innovation Actions (UIA) program of the European Commission (https://uia-initiative.eu/en/uia-cities/barcelona-call3). It includes a solid monitoring and evaluation process in order to assess if, and to which extent, the implemented interventions fulfilled the objectives of the project.
Why the evaluation process is important?
Evaluation is a continuous function to assess progress in achieving expected results, to define bottlenecks in implementation, and to highlight whether there are any unintended effects from the project and its activities.
Evaluation facilitates learning from past successes and challenges and those encountered during implementation. It links to the processes of planning and monitoring. Planning helps to design the road map towards the objectives of the project while monitoring supports the collection of data in support of the assessment of changes.
The elements of an evaluation process – which if developed together with all key stakeholders will encourage participation, increase ownership of the results, and better inform and influence decision-making and public policies design - are:
(a) tools to organize intended results, i.e. measurable changes;
(b) the monitoring plan, which contains a description of the processes to gather the relevant data on the set indicators as well as of the required tools. In particular, the monitoring plan systematically organizes the collection of specific data for analysis to support real-time, evidence-based decision-making;
(c) the various processes and methods for monitoring (such as regular input and output data gathering and review, participatory monitoring, process monitoring, accuracy definition, and error analysis) and for evaluation (including impact evaluation, environmental assessment, statistical analysis, etc.);
and, (d) the information system which is an organized repository of data to assist evaluation and analysis. In this Web Article, the evaluation process is described and the results regarding changes in the outdoor (schoolyard) air temperature field are presented for two case studies: Font d’en Fargas school and Poblenou school.
Results reflect positive changes due to the implementation of green, blue, and grey interventions at the schoolyards of the project. It should be mentioned that the evaluation process was also performed for the indoor air temperature fields, yet the results for the indoor air temperature fields will be discussed in a future publication.
The evaluation process of the Climate Shelters project
In the framework of the Climate Shelters project, the City of Barcelona designed and performed a well-structured evaluation process aiming to assess, among other parameters, the outdoor air temperature field at the schoolyards of the schools converted to Climate Shelters. The evaluation was designed and performed by the Barcelona Institute for Global Health (ISGlobal) and the Public Health Agency of Barcelona (ASPB), while it also focused on other aspects as well, such as : (a) the indoor air temperature field (b) the developed dynamics in the playground in terms of the diversification of play possibilities and socializing patterns, (c) health, well-being and types and levels of physical activity of the users, and (d) the attention levels in 5th grade children (to be published by ISGlobal in the near future).
Smart Citizen Kits (SCKs) were installed (Figure 1) outdoors at all schools participating in the Climate Shelters project; continuous measurements were made for the period May 2020 to September 2021. The scope of the measurements was to capture the initial (pre-interventions) and final (post-interventions) air temperature fields in the schoolyards. Control schools (i.e. no interventions implemented) were also monitored for comparison purposes, following the same approach.
Table 1 provides the type of measurements performed and the associated parameters.
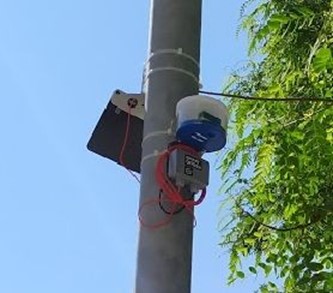
Table 1. Measurements and related parameters of the monitoring and evaluation plan (Source: ISGlobal).
|
Measurement |
Parameter |
|
Average temperature in the schoolyards |
Average temperature (℃) |
|
Maximum temperature in the schoolyards |
Average temperature (℃) of the 90th percentile |
|
Temperature anomalies in the schoolyards |
Kriging maps of temperature (℃) anomalies |
The evaluation methodology
The evaluation methodology was based on the statistical analysis of the measurements acquired by all SCKs for the entire monitoring period. In particular, kriging maps for the temperature anomalies were prepared. Kriging is the most commonly used geo-statistical approach for spatial interpolation. Kriging techniques rely on a spatial model between observations to predict attribute values at unsampled locations. The objective is to understand the relationships between observations separated by different lag distances.
Evaluation results - before and after the interventions
Case study 1. The Font d’en Fargas school
The monitoring process supported the acquisition of measurements of air temperature at several spots of the schoolyard (Figure 2a). Such measurements allow the definition of the air temperature field (Figure 2b), prior to the implementation of the blue, green, and grey interventions. The comparative examination of Figures 2a and 2b shows that the schoolyard exhibits higher air temperatures in all areas where greenery is limited and the surface is covered by impermeable construction materials.

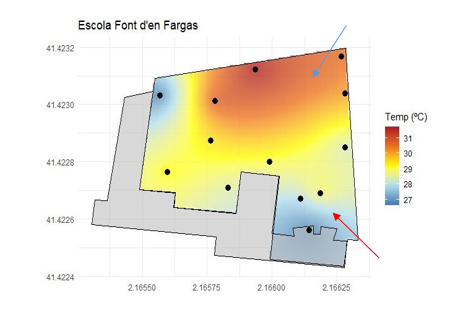
Figure 2. (a) Monitoring spots at the schoolyard (yellow dots) (b) Spatial depiction of the air temperature field in the schoolyard, prior to the project’s interventions. (Source: ISGlobal).
In Figure 3, the plan for the blue, green, and grey interventions for the conversion of the schoolyard of Font d’en Fargas school to Climate Shelter is presented.
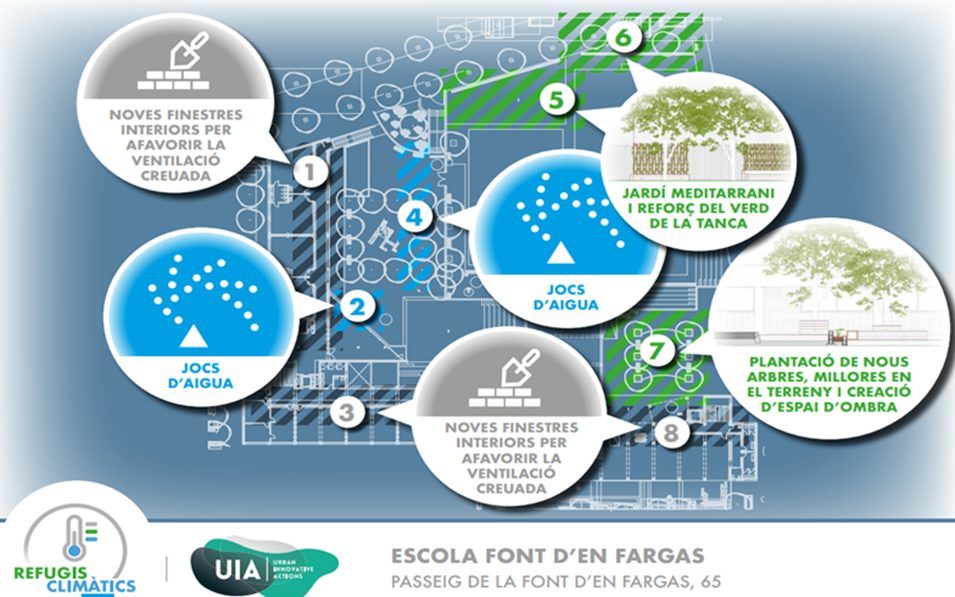
As seen in Figure 3, considerable attention is oriented towards the placement of greenery in those areas in the schoolyard showing high air temperatures. In particular, areas 5 and 6 of Figure 3 correspond to the areas shown with the blue arrow in Figure 2b, while area 7 corresponds to the one noted with the red arrow in the same Figure. Figure 4 shows the intervention that was implemented at point 7 (nature-based solution as well as change of the impervious surface with bare soil).
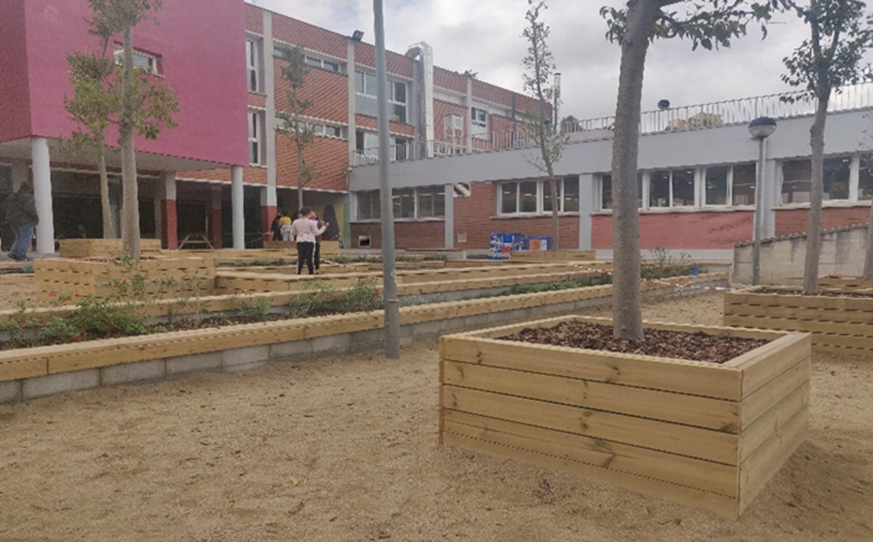
Figure 5 shows the plan of interventions (image a) as well as the air temperature fields in the schoolyard before (image b) and after (image c) of the interventions. The impact of the interventions to air temperature in the schoolyard is shown in Figure 5 (images to the left and right refer to the state of the schoolyard before and after the interventions, respectively). As seen, the air temperature anomaly has considerably decreased (by roughly 2-3 degrees Celsius) in all areas denoted with the arrows in Figure 2b.
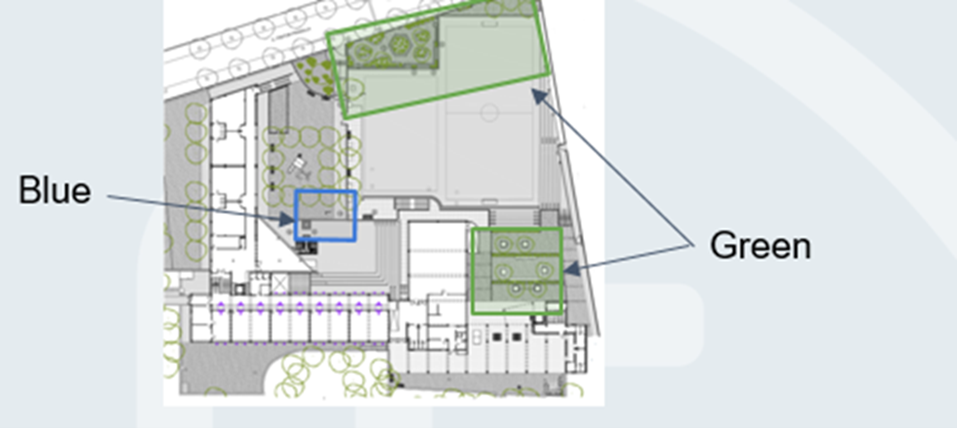
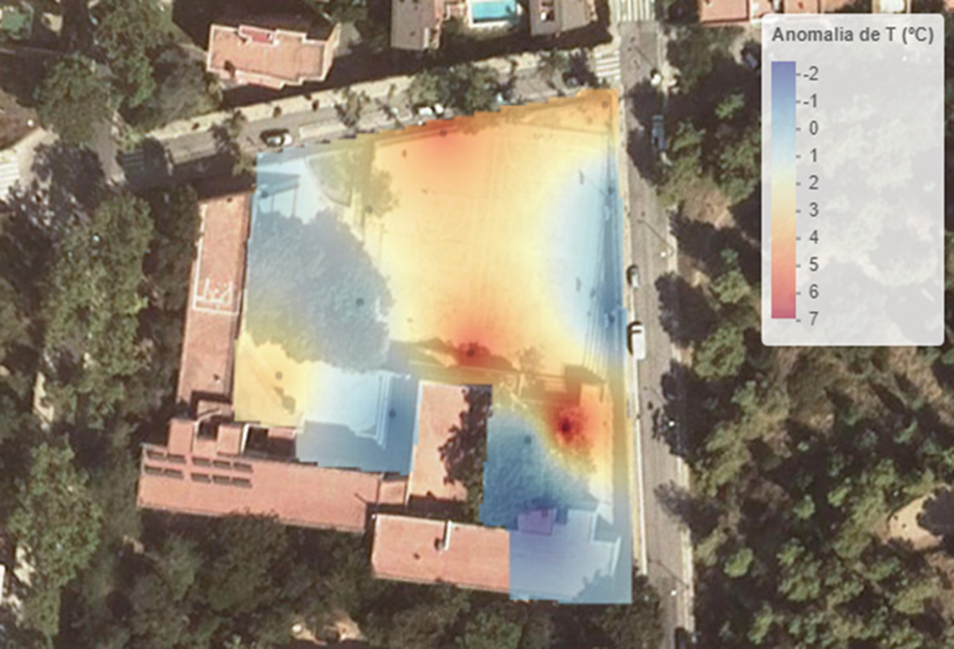

Figure 5. At the top (image a), the plan of interventions for the Font d’en Fargas school is seen. The air temperature fields before and after the interventions are provided in images b and c respectively (source: Borràs et al., unpublished data).
Case study 2. The Poblenou school
The plan for green and grey interventions at the Poblenou school is provided in Figure 6. The green intervention implemented in area 2 is shown in Figure 7; it consists of the construction of a school garden as well as of a shading pergola.
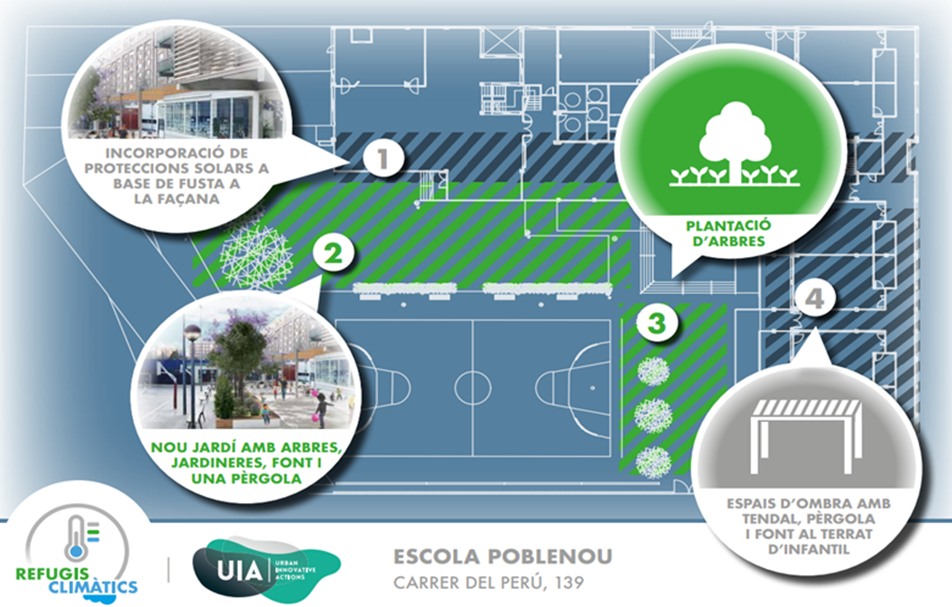
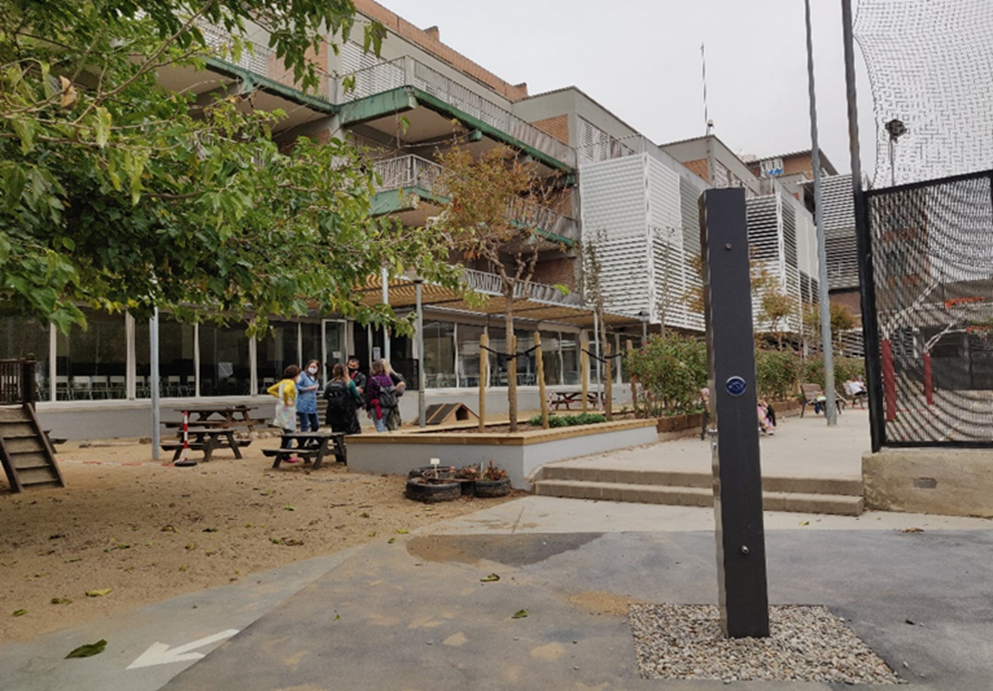
Figure 8 shows the plan of interventions (image a) as well as the air temperature fields in the schoolyard before (image b) and after (image c) of the interventions. A considerable decrease of the temperature field is observed in the schoolyard, as a result of the intervention presented in Figure 6 (point 2) and Figure 7. The improvement of the temperature anomaly accounts to roughly 2-3 degrees Celsius. However, an issue for consideration is the increase of the temperature anomaly observed at the area where the grey intervention took place.
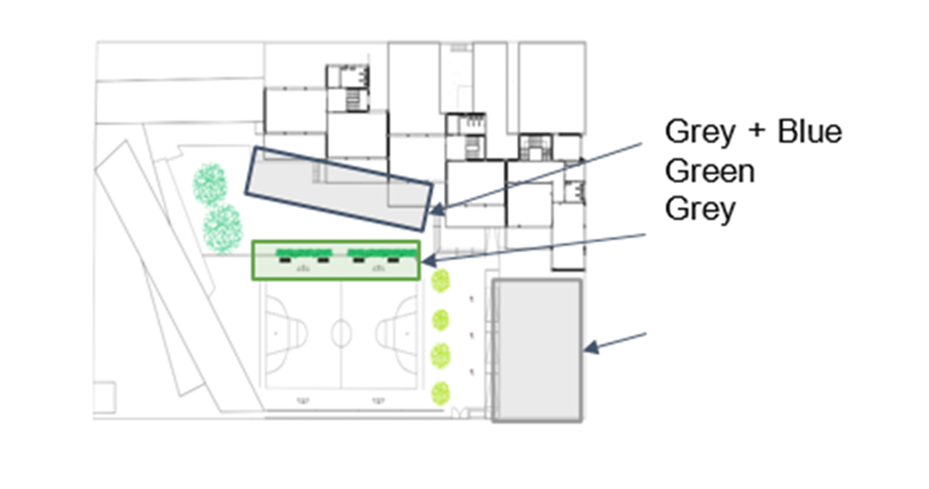
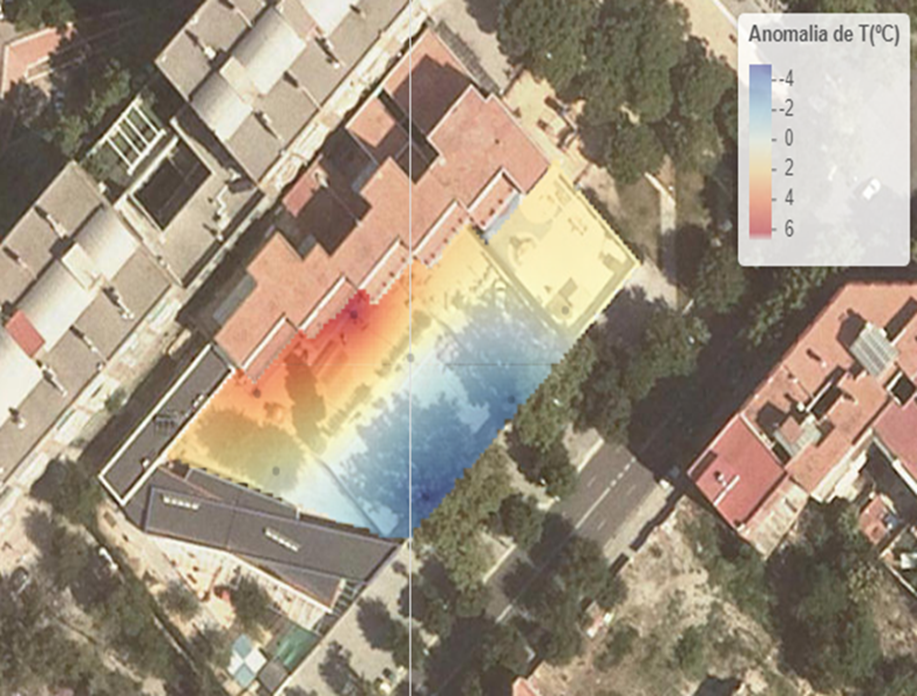
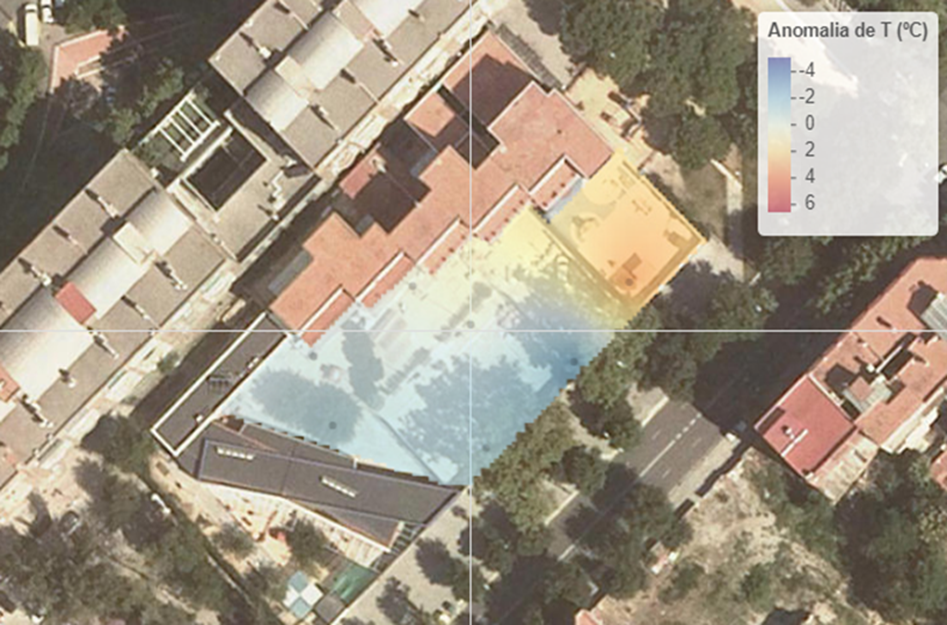
Figure 8. At the top (image a), the plan of interventions for the Poblenou school. is seen. The air temperature fields before and after the interventions are provided in images b and c respectively (source: Borràs et al., unpublished data).
Some concluding points
Evaluation constitutes an important process that needs to be an indispensable part of any project, not to mention an innovation project that tests novel hypotheses, methodologies, or approaches.
Usually, projects fail to define and/or sustain a thorough evaluation process due to the lack of data, measurements, and observations or in the event that the needed know-how is missing.
The Climate Shelters project has given strong attention to an evaluation process that is supported by a continuous monitoring process of various environmental and climate parameters in the schoolyards and in classrooms, as well as health, well-being, types and levels of physical activity of users and attention levels among 5th grade children.
The benefits of a well-designed evaluation strategy are evident, a fact that indicates the strong need the evaluation process to be a main pillar of the next phase of the Climate Shelters project, namely its upscaling in the framewotk of the "Let's transform our schoolyards" program that operates under the principle that the schoolyard also acts as a classroom. In this way, errors, if any, in the selection of the blue, green, and grey infrastructures as well as non-effective implementations will be identified, adapted and/or fixed accordingly.
About this resource


The Urban Innovative Actions (UIA) is a European Union initiative that provided funding to urban areas across Europe to test new and unproven solutions to urban challenges. The initiative had a total ERDF budget of €372 million for 2014-2020.

Similar content