Cairgo Bike - Focus on air quality, black carbon exposure


From the outset, the project looked to establish some means of assessing the level of pollution impacting on drivers and cargo bike users, and the potential mitigating effect of Cairgo Bike driven behaviour change. This article reports on the measures taken to evaluate the exposure situation, at street level, focussing on the particulate component rather than attempting to make some wider status report of ambient air pollution in the city. Basically the interest lies in understanding the impact increased use of cargo bikes can have on improving air quality and by reasoned association public health. What are the consequences of the cargo bike switch, in terms of direct health risk at street level and by association, the transport emission factor contributing to ambient air pollution?
Measuring exposure to black carbon - crowd science
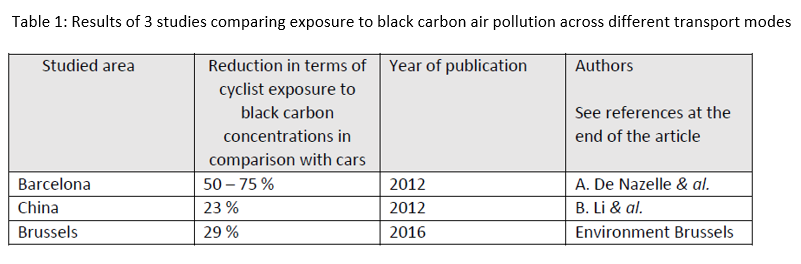
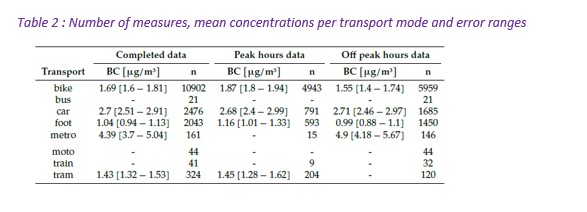
In Europe, and particularly in cities, it is clear that progress is being made in terms of: increased general (societal) understanding of risks associated with poor air quality; acceptance of the need to sustainably reform transportation and mobility operation, and; effective introduction of transformative measures. Several studies focussing on exposure to atmospheric pollution by users of different transport modes have already been carried out in various regions, and results are globally positive in respect of cyclists, in comparison with concentrations inhaled by car drivers. The table below shows some results already reported.
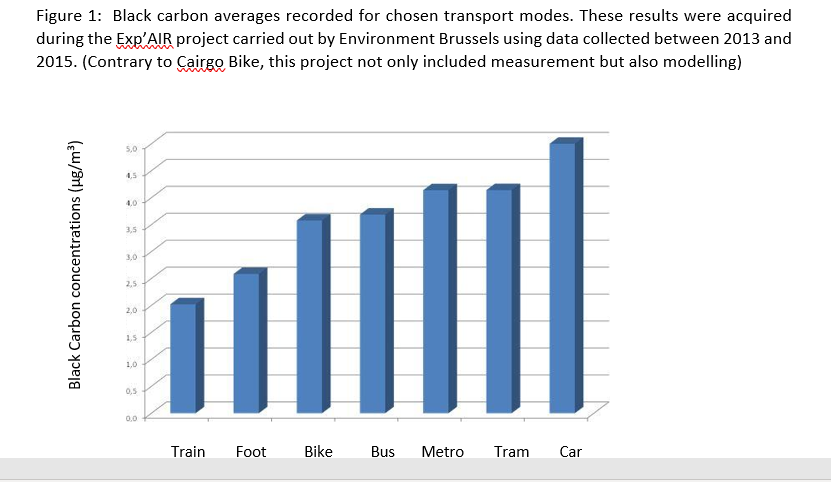
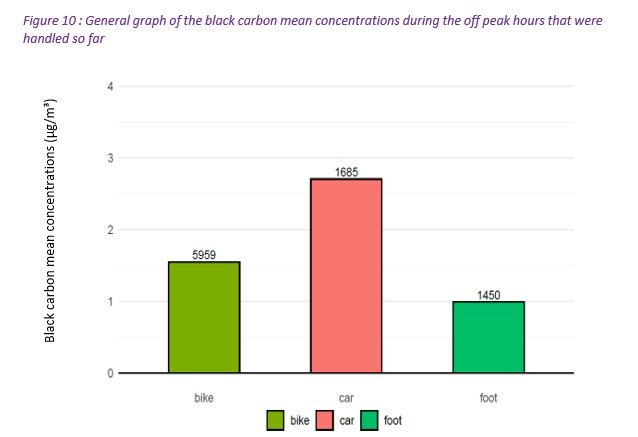
Between 2013 and 2016, the public institute Environment Brussels (BE) carried out a study to assess citizens exposure to air pollutants during their journeys, making a comparison between the results recorded for each transportation mode used. This provided the prime motivation for participation in Cairgo Bike. A number of factors can account for the somewhat unexpected advantage of cycling, including: being in open air as opposed to an enclosed but permeable inner space where particulates are not dispersed; wind and weather effects; cycle paths not in the axis of tail-pipe exhausts; choice of quieter traffic routes, even; often quicker journey times. The goal then is to spread the knowledge of this seemingly counter-intuitive fact, and so eventually encourage participants to adopt the cargo-bike as mobility option for the long term. The following graph shows the average black carbon concentrations that were obtained at the end of this project.
Today the original premise underpinning the Cairgo Bike initiative remains valid. Air pollution still represents a hugely important environmental, public health risk and the transport sector remains a major source of damaging emissions in our cities, despite positive developments in automotive technology and traffic control measures. In the road network serving the Brussels Capital Region, the COVID-19 epidemic resulted in significant traffic reduction, and together with less air travel and lower industrial activity we could speak of a temporary improvement in general air quality through 2020 and into 2021. Today however, levels of traffic congestion in and around the city are again as high (if not higher) than pre-covid figures, probably still influenced by reduced use of public transport and increase in logistic activity.
These general assessments remind us of the context within which Cairgo Bike activity was developed. The core business of the project to mobilise behaviour change, centres around the communication element of the project and the programmed participation in testing and training activities:
- raising awareness, encouraging people to understand how their mobility choices influence their exposure to pollutants;
- explaining the opportunities offered by the project, and;
- targeting and mobilising citizens (families) and professionals to convert to cargo bikes.
It was consciously decided therefore to examine health risks for cargo bike and vehicle users, within the context of a conversion trajectory, so focussing on the target group (training and testing) candidates as a potential source of data gathering. A specific measurement campaign was then designed to engage volunteers to measure their exposure to black carbon in both modes of transport – their accustomed mobility option (own vehicle) and the cargo bike[1]. Particulates (PM 10 and PM2.5) are the result of incomplete combustion of fossil fuels (black carbon PM2.5 particles have a diameter of less than 2.5 micrometers which represent a real infiltration threat). In urban areas they constitute an effective marker in terms of pollutant levels emitted by road transport, while recent studies show that because of the fineness of the particles they also represent one of the most toxic components of such emissions. The option adopted is therefore to measure exposure to this segment by means of sensors combined with log book recordings, where emission exposure is monitored in relation to the experience and activity pattern of individual users.
The information gathered can then ultimately feed an online tool app at the end of the project, that provides optimal, least polluted, route options for their cargo bike trips. Results directly measured by users ensure a broad data set as well as generating strong ownership of the initiative.
Brussels Environment delivers individual reports to involved participants, using this to help participants interpret the results of their measurements by identifying sources of pollution, factors influencing the presence of pollutants and stimulating reflection on how they can make a concrete contribution to improving air quality. Exposure results will be used to better inform participants and the wider public about air pollution, so using nudging to convince them of the self-interest advantages of using a cargo bike. At the end of the measurement campaign a comprehensive report analysing and interpreting the results will be published – highlighting the differences in exposure to pollutants between modes of transport (cargo bike – combustion engine vehicle). Based on the results obtained recommendations will be made to further optimise and reduce the exposure of cargo bike users.
[1] This builds on expertise acquired by Brussels Environment through their involvement in the Exp’AIR project since 2013. In contrast to the CurieuzenAir citizen science initiative, the option was firmly taken in Cairgo Bike to examine exposure levels impacting on transport users, at street level, in traffic and specifically focussing on the health risk posed by the black carbon component.
The objective is to carry out measurements made by 150 citizens and 20 professional (company, small business, self-employed) trialists. So selected project supported bike users (citizens via Pro Velo and business via Urbike activities) participate by wearing black carbon measuring equipment for a period of at least one week. Citizens use it during two weeks (their cargo bike trial) and professionals are asked to measure during two to three weeks. One employee for instance has measured one week with the cargo bike and one week using a van, and this exercise can be extended. The selection of cargo bike users participating on a voluntary basis, is based on questioning concerning the frequency of trips made with motor vehicles, as well as smoking habits in order to limit potential compromising factors.
The objective is to carry out measurements made by 150 citizens and 20 professional (company, small business, self-employed) trialists. So selected project supported bike users (citizens via Pro Velo and business via Urbike activities) participate by wearing black carbon measuring equipment for a period of one week. The selection of cargo bike users participating on a voluntary basis, is based on questioning concerning the frequency of trips made with motor vehicles, as well as smoking habits in order to limit potential compromising factors.
The project has purchased 10 portable aethalometers measuring black carbon in 5 wavelengths and integrating a GPS sensor. These devices are low-cost and generally reliable, but still care needs to be taken, checks made, when interpreting results. The optical measurement in 5 wavelengths allows the relative levels of black carbon emitted by road transport (exhaust, tyre and brake) and wood heating systems to be estimated. The devices are assigned to selected Pro Velo and Urbike clients so that participants can measure their individual exposure and better understand how their mobility choices directly impact their health. Some candidates were also willing to keep the device operating in their home environment, which provides important additional exposure data. On the other hand some found the constant noise of the pump function irritating even though this is mitigated by using the carrying satchel with noise insulating layer. A selection process is necessary to exclude smokers and ensure that the socio-economic profile (diversity, owner of vehicle, car use patterns) is relevant for the research planned by the VUB.
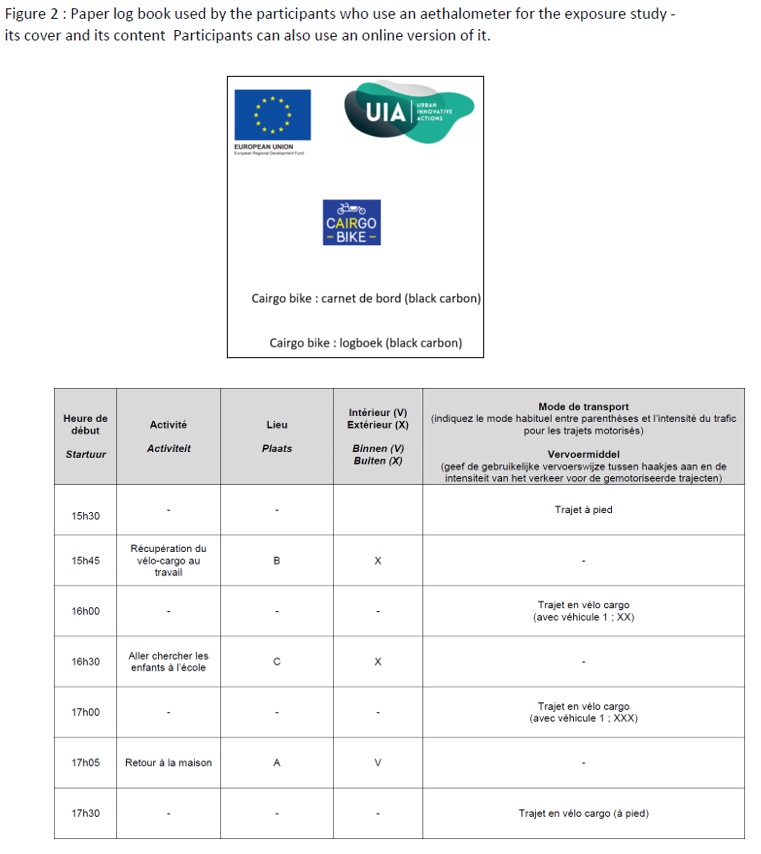
During the cargo bike trial period, the citizens are required to fill in a log book. Data gathered in this way is shared by Environment Brussels and the VUB university partner including: departure and arrival times; destinations; transport mode used for each trip, mode that would have been used if the person was not participating in the project… All participants who use a device fill in the log book while the aethalometer also provides geo-localised data.
The integrated geo-location system is useful to map the emission contribution measured during the trips and provide detailed feedback to participants in a report presenting their results and a brief analysis of the consequences. Reports include : an exposure assessment for all modes of transport used; a mapping of black carbon concentrations for trips made with the cargo bike and equivalent mapping particularly for trips with motor vehicles but also other modes used during the test period; maps show participants the temporal evolution of concentrations over the different routes; graphs depicting all mean concentrations per transport mode/per day and similarly indoor concentrations for participants who continued to operate the device at home.
The experience of working with the volunteers proved quite challenging in the initial stages, so a first clear briefing was essential, but equally review and follow-up was recognised as necessary.
The delivery of new aethalometers was delayed by several weeks. This meant that Environment Brussels couldn’t mobilise participants from the first Municipality test and trial experience to contribute to the exposure study. Replacement devices from another Belgian institute were used to bridge the gap, but the combination of two different data sources (from replacement and then new devices) was problematical in terms of uniform interpretation.
Preparing people to use the device and explaining the requirements to operate and report correctly was complicated and time-consuming. Sometimes participants didn’t use the device at all, even though they had agreed to wear it and despite the information provided during the cargo bike pick-up meeting. Participants weren’t always rigorous in filling in their log book, sometimes recording very approximate timings. This meant extra revisiting by Environment Brussels to detect real trip times and avoid high imprecision creeping into the data. As the learning process has progressed however, we have noted that many participants are really interested in knowing about the concentrations they have inhaled during the test, the comparison between transport modes and for some the indoor home conditions. That has surely been positive in building willingness to contribute and to strive for accurate results.
Mobilising the professionals group to participate has also proved more problematical than expected. The message seems to be that becoming familiar with the new transport mode and changing operational practice, costs enough time and effort without adding on any other requirements. In fact professionals actually need less information to be given, and in theory methodology is easier for the participants who are only confronted with the choice of either vehicle or cargo bike, and also don’t need to fill in a log book because of their programmed trips for work purposes.
Despite initial Covid impact in terms of material procurement and citizen participation, enthusiasm among volunteers has grown steadily and now some 79 people have used the aethalometers. Not all provided workable material, but this clearly demonstrates the level of engagement and interest generated among participants, to gather valuable trip exposure data and feed the knowledge.
Now that the measurements from participants is filtering in to the environmental study, Environment Brussels has focused essentially on the relation with device users, preparing their individual reports which are then sent to them. In conjunction the implementation of the programming code has been important to ensure quality of the data management and correct data encoding.
The figures 2, 3, 4, 5, and 6 are included in the individual reports distributed to participants. The graph below allows each participant to compare his/her data with mean concentrations (semi-transparent columns) that have been collected and processed since the beginning of the tests. The values that appear above the columns are related to the number of measures which have been taken into account. The next two graphs reveal daily concentrations with an analysis per transport mode and a focus on indoor air (this subject is a real concern expressed by citizens – which is extremely positive – and so information about indoor concentrations is reported back wherever possible).
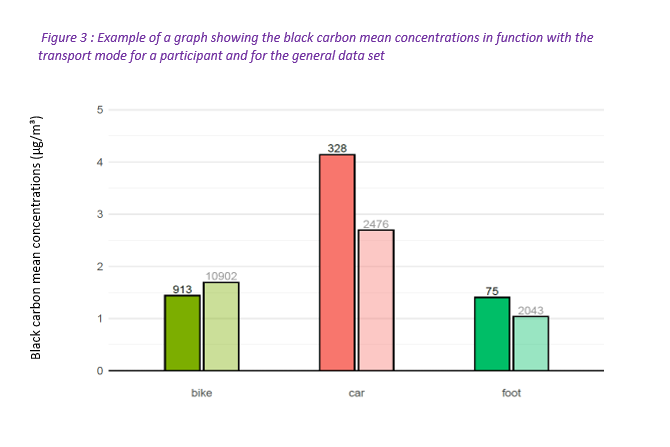
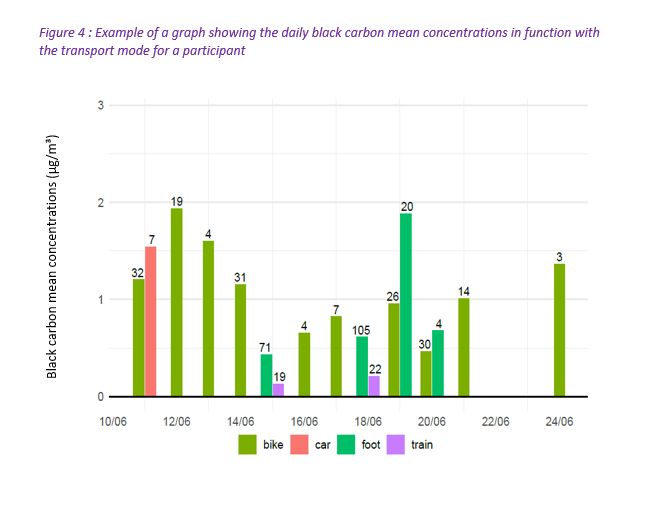
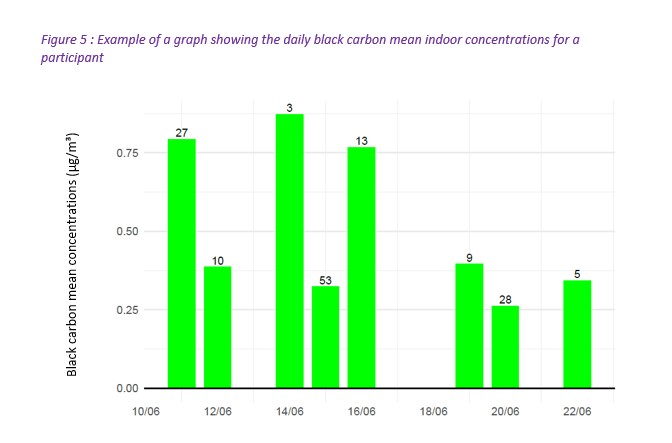
Figure 6 : Example of a general mapping of all the different participants’ trips and the black carbon concentrations she / he measured during these travels
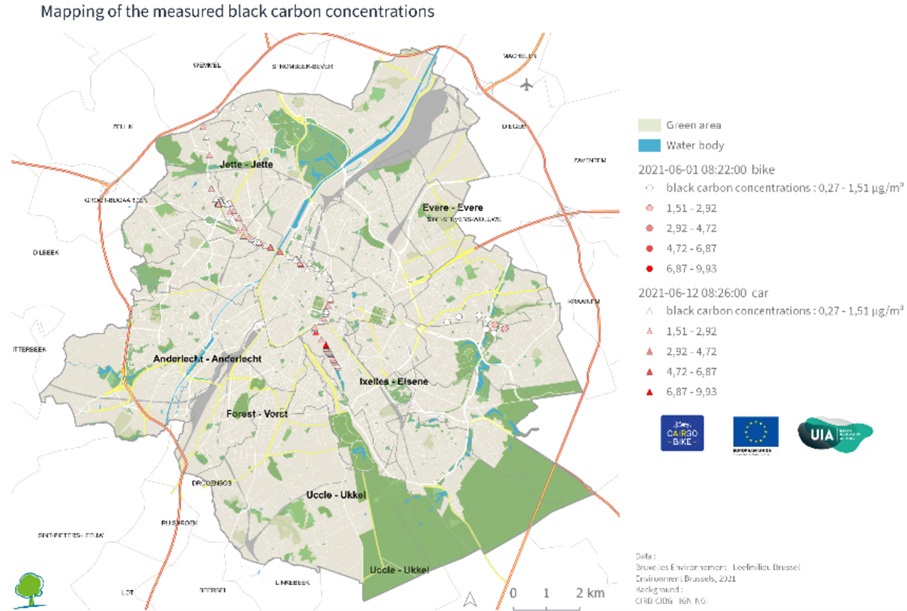
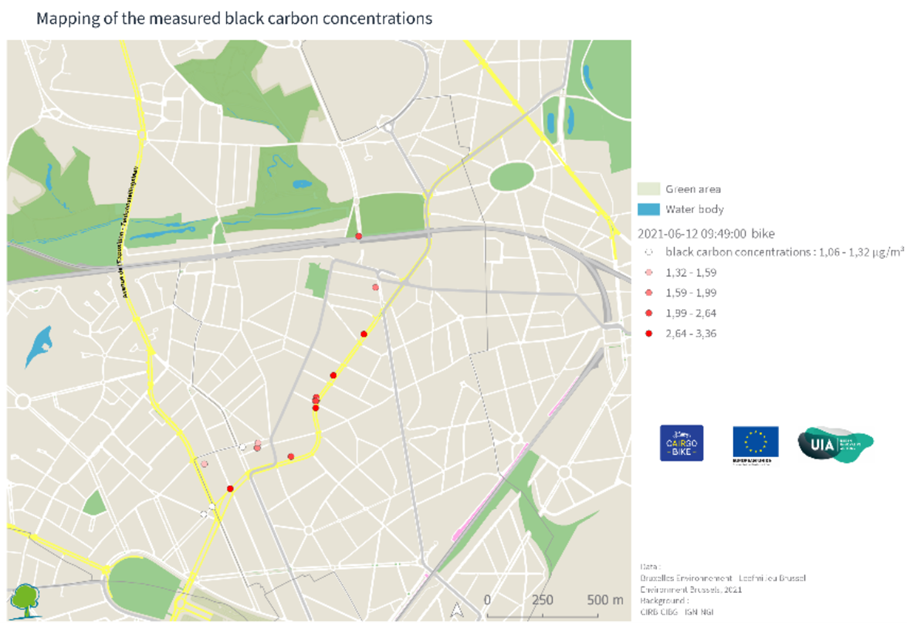
Figure 7 : Example of mapping focusing on one trip and the measured black carbon concentrations of it
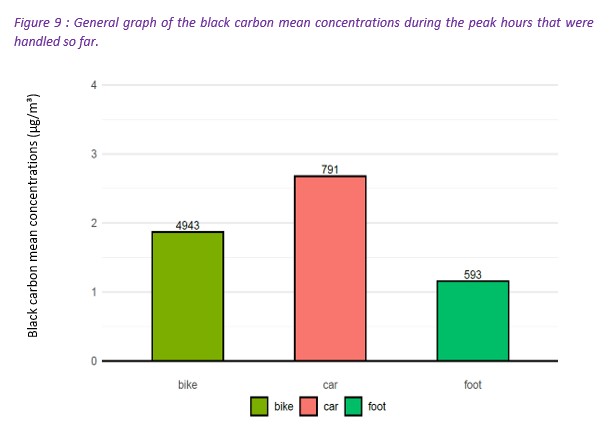
So far, the general study primarily involves comparison of recorded concentration levels per transport mode and per hour (peak and off-peak hours). The figures 8, 9, and 10 were constructed from a data set compiled using data from thirty-eight participants. The results do not take any concentrations data from professionals into account. The measurement unit used is always microgram per cubic meter (1 µg/m³ = 10-6g/m³). Table 2 shows the mean concentrations encountered per transport mode, the error ranges, and the number of measurements recorded and taken into account. It is interesting to note that the error ranges from the three transport modes studied do not overlap each other and as a consequence the validity of comparing the different transport modes is justified. These results are very exciting and highlight the significant advantage of using bikes (and so cargo bikes to transport children and for delivery drivers) as a healthier alternative to car travel in terms of exposure to fine particulate concentrations and poor air quality.
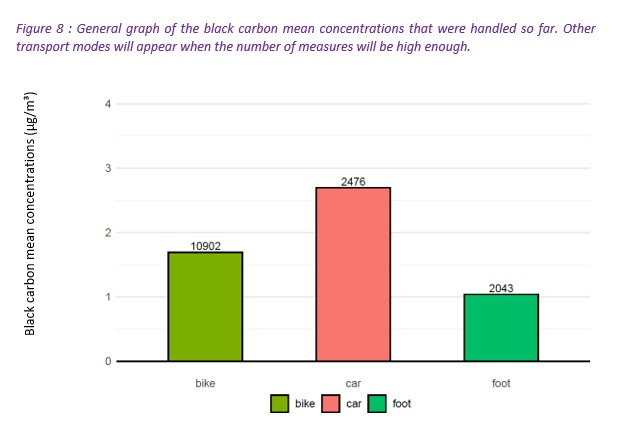
While the data set is by no means complete at this stage and mobilising professionals to embrace the use of aethalometers is a work in progress, there are already interesting signals appearing. It seems that the Cairgo Bike experience is confirming earlier innovative research, in the sense that cycling in the city can actually reduce exposure to black carbon when compared to vehicular transport modes. The involvement of ordinary citizens to feed the knowledge and arrive at such a conclusion is instrumental, but it also has another impact in terms of communication. The reporting back to participants ensures that the experience is talked about among friends and family, at the school gate and in the workplace, generating discussion on a subject which otherwise would have remained in the background. This is an added bonus for the communication process where informal, word of mouth exchange supports any official statements.
The process of involving volunteers in something unconventional and “new”, carrying a measuring device for all journeys or all day provides some important lessons, which have even resulted in certain adaptations within the project. Because the experience is novel for participants (over and above coming to terms with using a cargo bike), even the most well prepared explanation and user guides may not guarantee optimal understanding and compliance with expected use patterns and reporting. A hands-on approach to review - return to candidates, refine data received - as Environment Brussels has done is probably essential. In fact it may be interesting to use a first group of volunteers to carry out a test-run, in order to gauge how far people have understood what is required, to evaluate how far and how disciplined they are prepared to go. Here this might even lead to a tighter selection process for example, or adaptation of previewed ways of working, but not at the cost of excluding diversity obviously. In terms of mobilising the private sector employees, sme’s and self-employed it appears that a more targeted approach may be necessary. It could be advantageous to identify in advance, companies or individual business operators who could be most motivated or interested to support the science – is it in their own interest, can they use it for publicity, is sustainability an important part of their mission statement? Here for instance the evolving engagement of the Brussels Water Company, Vivaqua can potentially unlock any resistance within their professional activity pattern. In any case the experience gained by this exercise should not be lost in terms of identifying difficulties and problem solving.
As the Cairgo Bike project progresses towards conclusion, a more general study will be carried out based on fuller data collection and processing to focus on the variability of concentrations in space and time. Within the framework of the individual reports, all the recorded concentrations were adjusted in alignment with black carbon data from the telemetric network of the Brussels area in order to avoid high differences appearing as a result of seasonal variability in air quality. Comparing effectively measured data with other measurements in the same street may highlight different trends occurring based on seasonal variation.
An assessment of the impact of street geometry will also be carried out. Narrow streets characterised by very high buildings, the so-called “canyon streets” are a real concern in terms of the build-up of atmospheric pollutants. An analysis of the spatial variability of concentrations in function of different environmental parameters will be carried out as a mapping exercise using the Environment Brussels digital cartographic capability.
De Nazelle A., Fruin S., Westerdahl D., Martinez D., Ripoll A, Kubesch N. & Nieuwenhuijsen M. 2012. A travel mode comparison of commuters’ exposures to air pollutants in Barcelona. Atmospheric Environment 59, 151-159.
Ham W., Vijayan A., Schulte N. & Herner J. 2017. Commuter exposure to PM 2.5, BC and UFP in six common transport microenvironments in Sacramento, California. Atmospheric Environment 167, 335-345.
Li B., Lei X., Xiu G., Gao C. S. & Qian N. 2015 Personal exposure to black carbon during commuting in peak and off-peak hours in Shanghai. Science of the Total Environment 524-525, 237-245.
UCL & Bruxelles Environnement. 2016. Développement et exploitation d’outils de modélisation visant à améliorer l’évaluation de l’exposition aux polluants en Région de Bruxelles-Capitale, en support aux études santé-environnement.
About this resource

The Urban Innovative Actions (UIA) is a European Union initiative that provided funding to urban areas across Europe to test new and unproven solutions to urban challenges. The initiative had a total ERDF budget of €372 million for 2014-2020.

Similar content