An innovative platform for environmental monitoring

The control units are also installed in schools and public buildings so that citizens and students can use them freely and contribute to the project in a participatory way. This best practice has the potential to be widely replicated in other European municipalities.
The UPPER project aims to implement solutions based on NBS nature in order to contrast environmental problems due to the rise in temperature, the increase in air and water pollutants. As part of the UPPER project, the partner ENGIE deals with the analysis, monitoring and visualization of environmental data in order to follow the evolution and highlight the main environmental effects of the project in the city, such as for example the reduction of the effect "Heat island" and the variation of air quality.
For this purpose, ENGIE has developed the UPPER ENGIE digital platform, which has the aim of returning environmental data in real time and historical analysis of the urban context of the project's intervention areas.
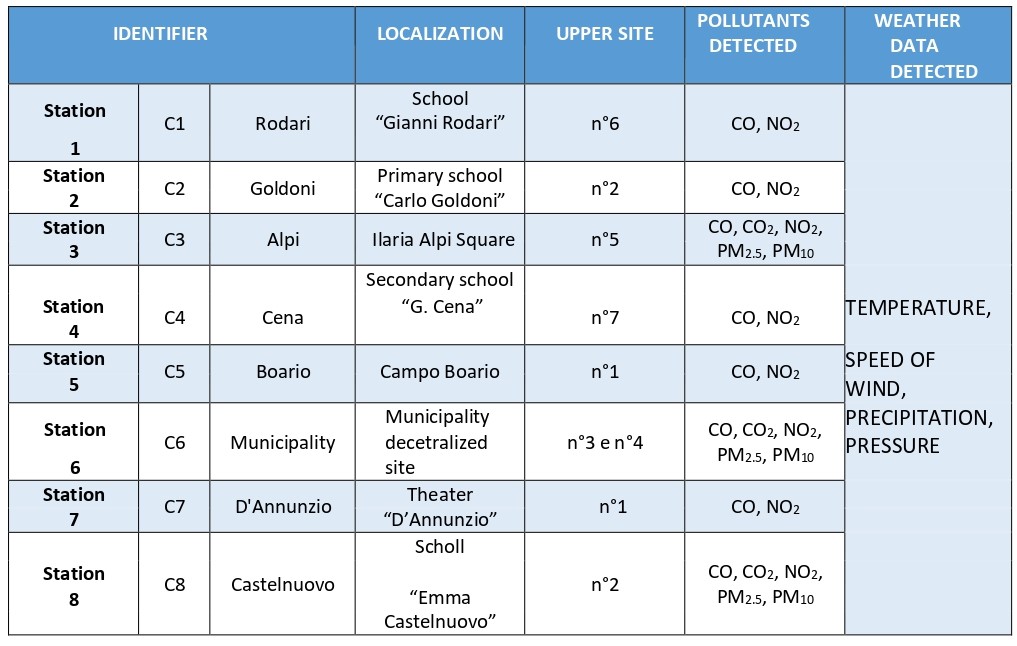
The data is collected and transmitted thanks to a monitoring network consisting of 8 stations located in the Latina area within the demonstration sites, to which air quality sensors, atmospheric pollutants and weather parameters are connected.
The transmission of data from the control units to the platform is guaranteed by a connectivity network installed in the area. This is the means by which the data measured by the sensors in the field is sent to the backend of the platform, where it is collected and analyzed to extract information. The digital platform was developed with serverless technology on the AWS cloud.
The side menu, on the left of the screen, allows to select six different tabs:
• Home
• Environmental monitoring stations
• Pollutants and air quality
• Atmospheric data
• Alarms
• Info
 |
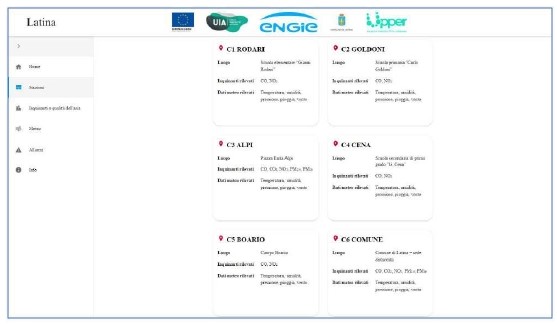
In detail, the "Environmental monitoring stations" tab allows to view a basic map of the area under analysis on which the eight monitoring stations are identified. The sensors have been placed near the main areas that are expected to have an impact on environmental conditions, resulting from their redevelopment.
In addition to show on the map the exact point where the control units are installed, this system includes eight cards with specific information for each station: the installation site identified in the municipal area, the pollutants and the weather parameters detected.
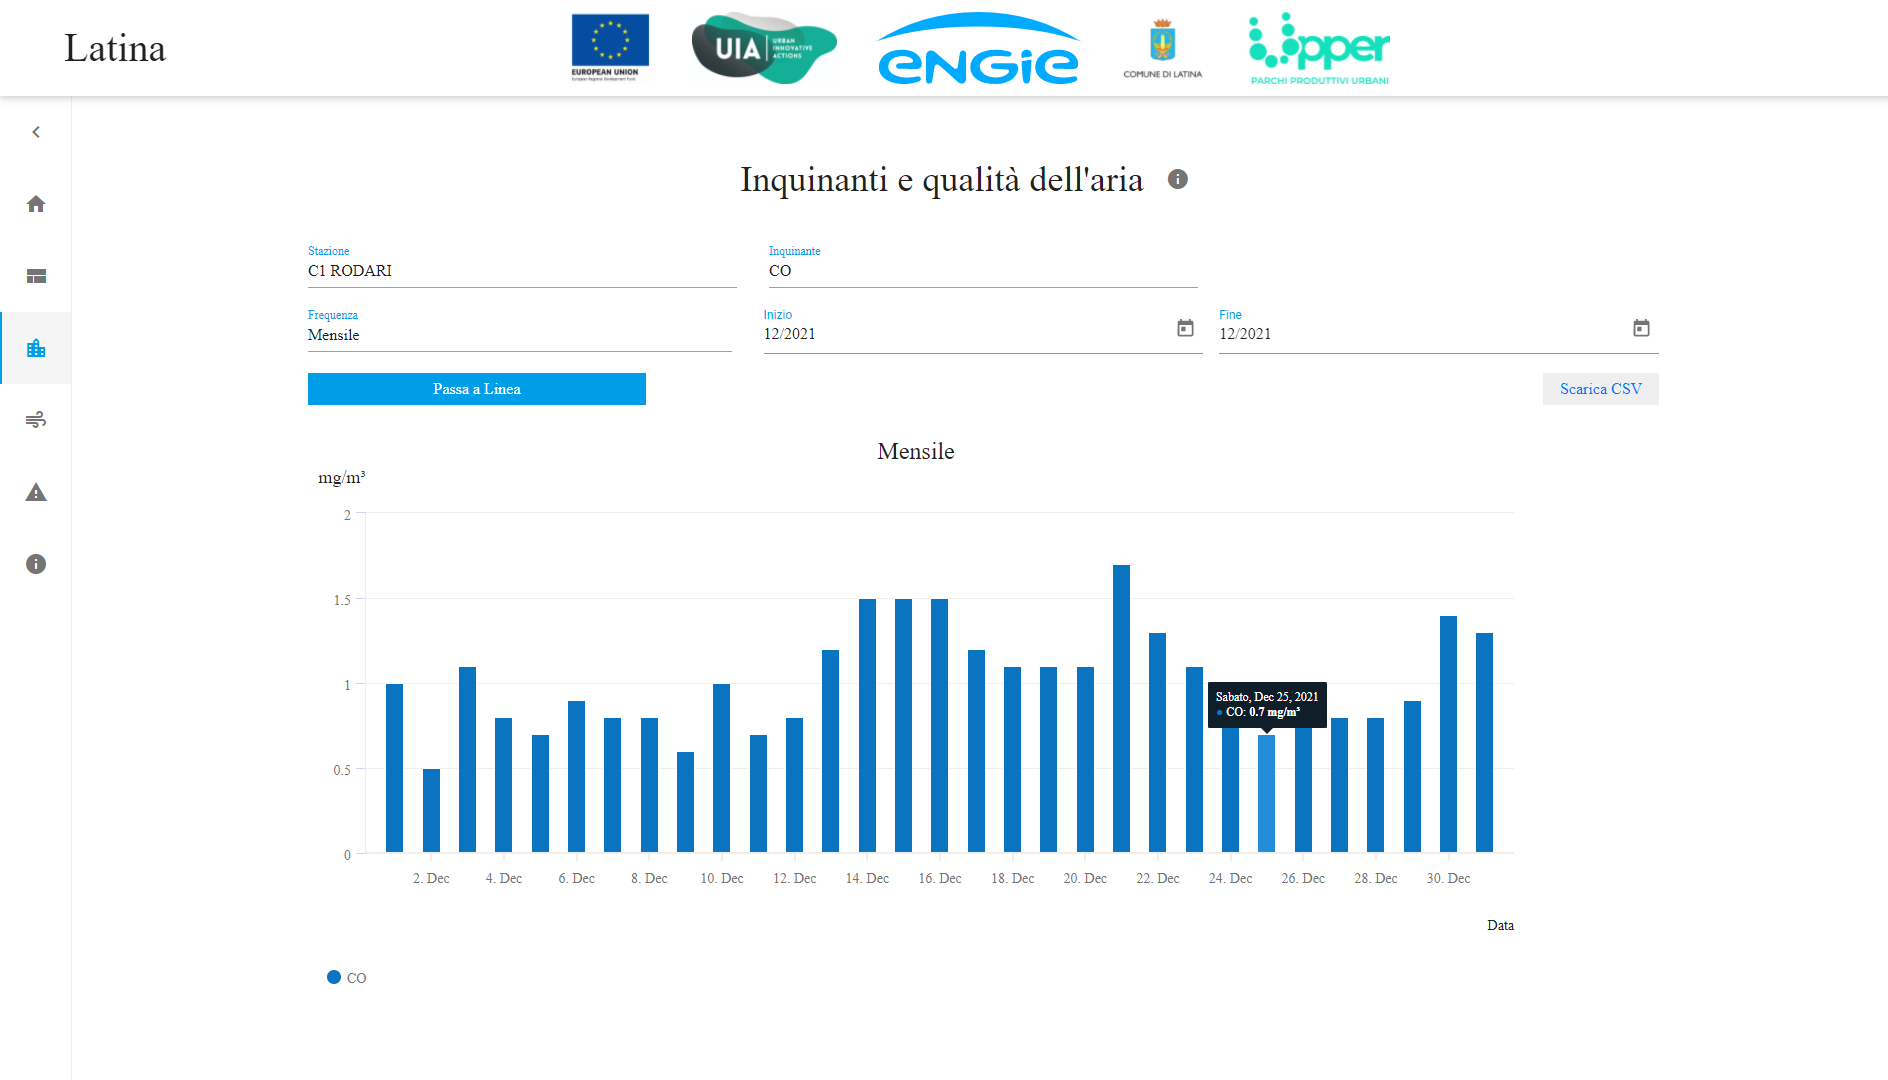
The "Pollutants and air quality" and "Atmospheric data" tabs collect and graphically show the trend of the monitored data.
The main pollutants detected are:
• carbon monoxide (CO), an odorless and colorless gas generated during the combustion of organic materials when the amount of oxygen available is insufficient. The main source of CO is represented by vehicular traffic;
• nitrogen dioxide (NO2), a pollutant that is normally generated as a result of combustion processes. In particular, among the emission sources, vehicular traffic has been identified as the one that contributes most to the increase in nitrogen dioxide levels in the ambient air.
In the Atmospheric data tab it is possible to view data regarding:
• humidity
• rainfall
• pressure
•temperature
• wind speed.
Three combo boxes allow to select the station, the pollutant or meteorological parameter and the display frequency of the aggregated data by current day, last week, month or year. It is also possible to download specific data, with respect to the selected item, thanks to the dedicated button "Download CSV" placed under each graph.
It should be noted that the data shown are detected in near real time and are not the result of subsequent processing, but are in any case subject to a validation process.
The "Alarms" tab is filled with cards when particular critical issues arise during monitoring. The alarms shown in this sheet refer in particular to the exceeding of the limit thresholds on pollutants, set starting from those reported in the national legislation. Alarms can also report information on sensor functionality.
The first step made to set up the system was to design the station network. The places where to install the sensors were identified on the basis of the project tables relating to the area interventions, selecting those that were expected to have the greatest impact on the environmental conditions of the neighbouring areas.

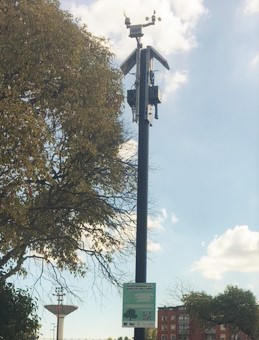
The sensor network was planned in terms of correct positioning of the monitoring stations, choice of environmental sensors, identification of communication technology, electricity supply. The choice of sensors useful for carrying out environmental measurements fell on the Libelium Plug & sense! smart environment PRO meeting the IoT requirements, in terms of precision, communication and energy consumption.

It was then necessary to define a communication technology, in terms of devices, protocols and back-ends, that is a system for receiving and communicating the data received from the sensors in the field. This choice was made to ensure communication reliability at low costs, both in terms of energy and economic consumption.
LoRa communication technology was chosen since it is the best performing solution in terms of limited costs and manageable energy consumption with photovoltaic power supply.

Thanks to the innovative platform the first environmental data have been collected and processed by the partners.

The urban redevelopment proposed by Upper, thanks to the contribution of the innovative platform developed by ENGIE, becomes not only a proposal for sustainable use of the territory and solutions based on nature, but also makes a strong contribution towards the digital transition.
The platform will contribute to improving the urban environmental footprint, the city environment and the quality of life thanks to the use of sustainable land measurements, through three main environmental monitoring activities (ex ante, "in itinere", ex post) .
The data measured by the sensors in the field are sent to the backend of the platform, where they are collected and analyzed to extract information: the trend of the main atmospheric pollutants (CO, CO2, NO2, PM10, PM2.5) and meteorological data (Temperature, Humidity , Wind Speed, Precipitation, Pressure), for the entire duration of the UPPER project, and the monitoring of KPIs, i.e. the concentration of PM10 and NO2 and the perceived temperature in the summer months.
It is also possible to download the specific data measured by selecting the reference station, the pollutant or weather data and the time frame defined for the extraction.
The innovation proposed by the project is also based on the creation of the Upper Observatory as a result of the interaction of UPPER ENGIE with the WHIP platform created by the CeRSITeS partner of the La Sapienza University of Rome.
These platforms will work in parallel to represent different aspects of the characters and environmental conditions of the areas subject to Upper interventions. In particular, UPPER ENGIE will report the data relating to air quality conditions and the main meteorological data, while in WHIP (WebGIS Holding Interactive Platform) in the areas of intervention the related analyzes of the abiotic components and plants will be displayed. This platform is also be designed to allow interaction between technicians, citizens and inhabitants close to the intervention areas.

The platforms will communicate at the back-end level through an exchange of data, in order to provide an integrated view of the environmental conditions detected in the field.
Thanks to both platforms, it will be possible to contribute to making the environmental impact assessment of Upper's interventions in production parks and experimentation areas transparent and participatory.
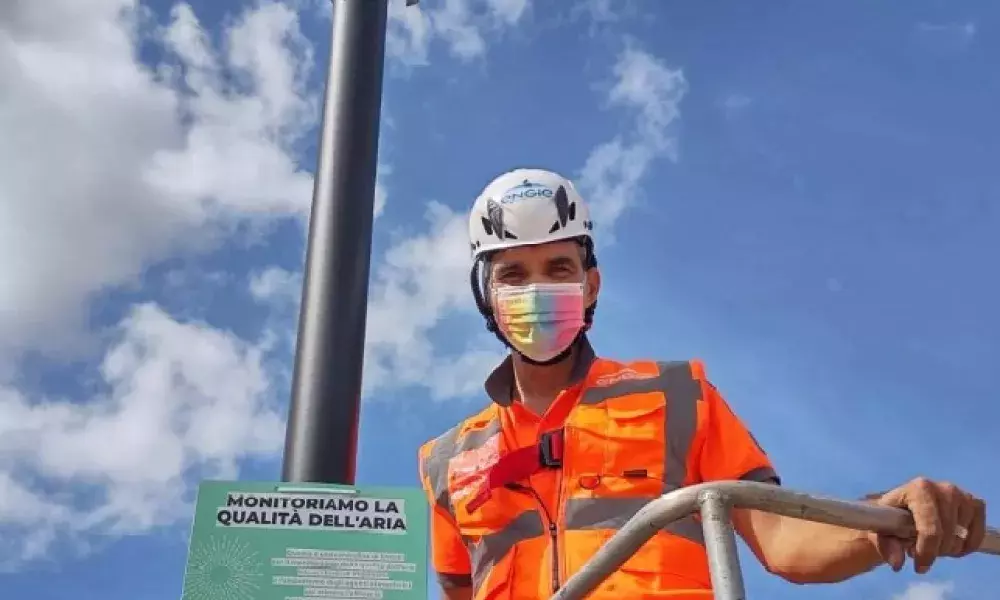
The control units are located on municipal buildings and are also present in schools where children participate in awareness / involvement paths within the UPPER project.
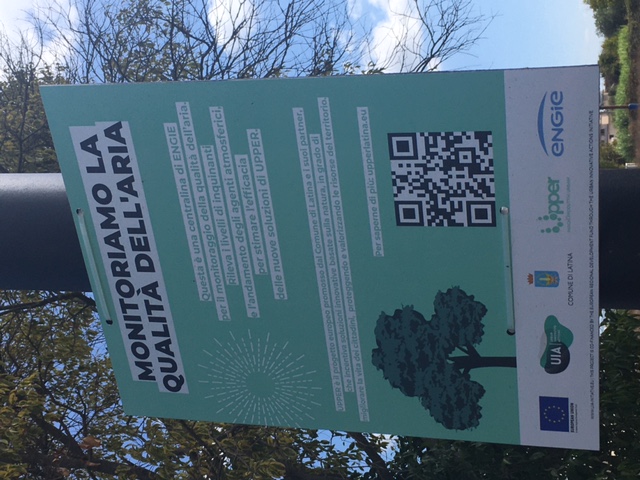
Each station is indicated by panels with QR Code through which every citizen can have direct access to all information and environmental data.
Such technologies can be also transferred to other European Cities who needs to constantly monitoring their environmental data to improve local conditions to implement climate resilience actions too.
The ENGIE platform is accessible at the following link https://upper.aws.engie.it/stations while the WHIP at https://www.cersites.gter.it/webgis_lpdt/lizmap/www/index.php/view/map/?repository=lab&project=UPPER_WHIP
About this resource


The Urban Innovative Actions (UIA) is a European Union initiative that provided funding to urban areas across Europe to test new and unproven solutions to urban challenges. The initiative had a total ERDF budget of €372 million for 2014-2020.
Similar content