2. Profile of respondents
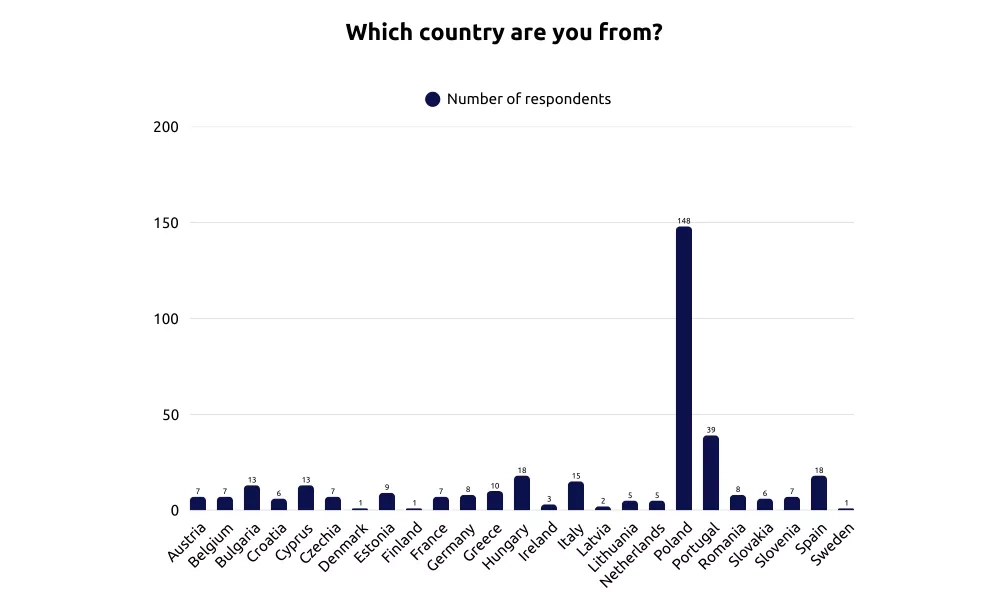
The survey received 365 responses, one of which was considered not valid as it came from outside the European Union. The 364 valid responses came from 104 different regions across 25 EU countries, covering all Member States except Luxembourg and Malta. There was an extremely high participation from Poland (148 responses) and Portugal (39 responses), followed by Spain (18), Hungary (18) and Italy (15). At the other end of the spectrum, some countries, notably Finland, Sweden and Denmark, had only one response each.
The number and geographical distribution of responses may appear unbalanced. However, it is important to emphasise that these statistics should not be interpreted as official representative samples of EU cities by Member State. On the contrary, the survey should be seen as a public consultation of urban stakeholders interested in EUI, where participation was voluntary and unrestricted, and there were no quotas per category. There was no expectation, nor requirement, to achieve a proportional distribution of responses across Member States. In fact, statistical tests suggest that the respondents’ country of origin has not appreciably influenced the findings[1]. Other variables, notably the level of development of the region, or the size of the city, appear to have a greater impact, as will be shown later in the report.
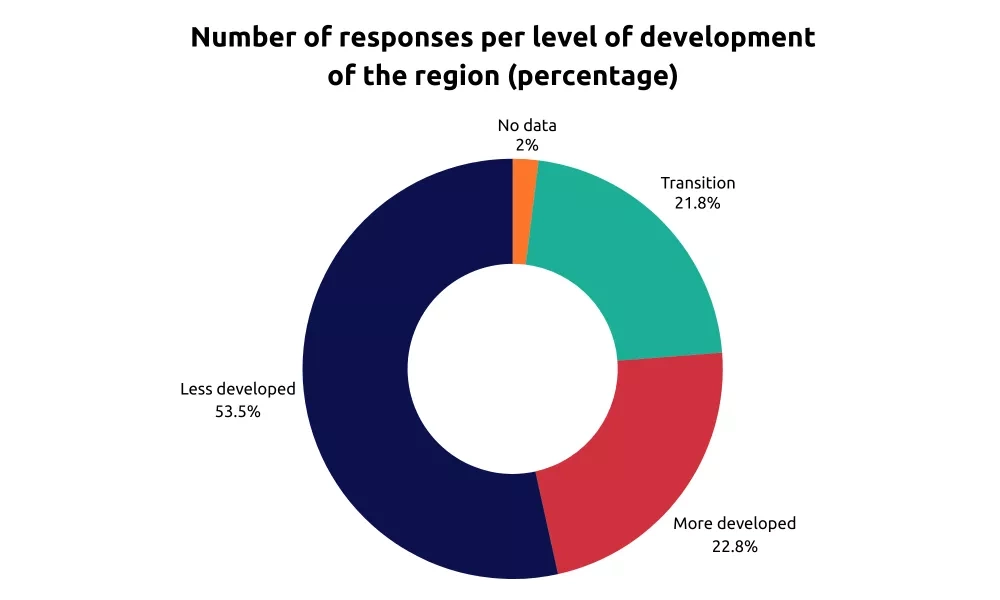
Most of the responses (54%, or 195 in total) came from less developed regions as classified by EU cohesion policy[2]. This result should be positively assessed, considering that this category of regions is in fact one of the main targets of EUI activities. The remaining responses were evenly split between more developed regions (23%) and transition regions (22%).
[1] Two types of tests were run, the first one comparing all replies with replies coming from Polish respondents alone, and those coming from all Member States except Poland. This first test showed that in most of the cases Polish replies did not change the rankings. A second test was done weighting replies based on the number of urban municipalities (LAU with degree of urbanisation 1) per Member State. The weighted results were not particularly dissimilar from the original ones.
[2] Cohesion policy covers every region in the EU. However, to target the funds where they are most needed, regions are classified into three categories: less developed regions with a GDP per capita under 75% of the EU-27 average; transition regions with a GDP per capita between 75% and 100% of the EU-27 average; and more developed regions with a GDP per capita above 100% of the EU-27 average.
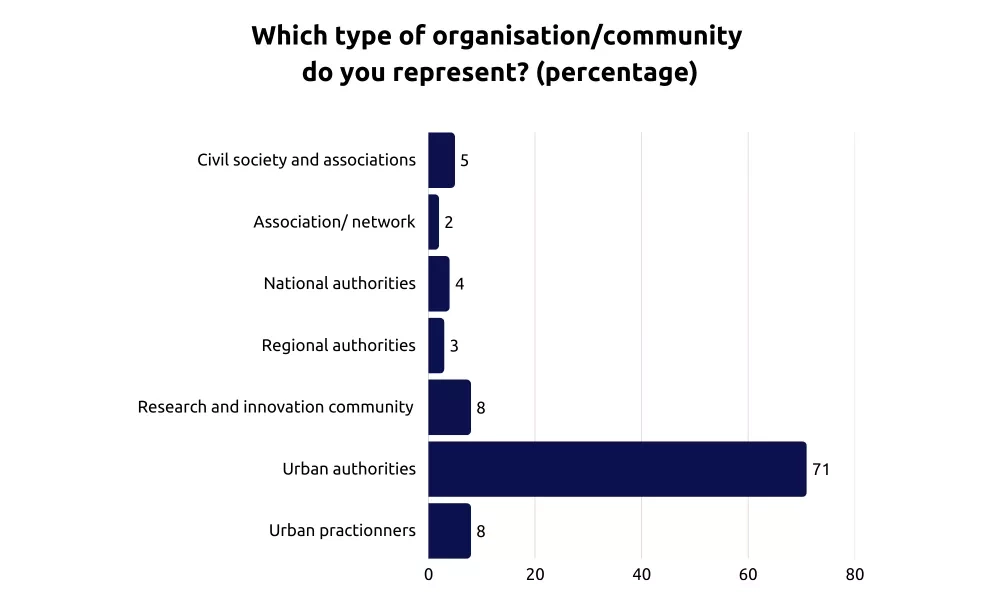
The survey targeted ‘cities’ in particular, meaning local authorities of urban areas. Not surprisingly, 259 responses (71%) came from representatives of urban authorities. The second largest categories of respondents were urban practitioners, and representatives of the research and innovation community, with 28 respondents for each group. Smaller numbers came from civil society and local associations (17 responses), national (15 responses) and regional (11 responses) authorities dealing with urban matters, and finally associations or networks representing local and regional interests at national or EU level (6 responses).
When looking in more detail at the cities who replied to the survey, it can be seen that more than half of them were towns with less than 50 000 inhabitants. This is an interesting and noteworthy result, because one of the purposes of the survey was precisely to reach the small cities and towns that are usually underrepresented in these types of studies, and more generally in EU level debates on urban matters. Smaller local authorities often have fewer human and financial resources, and for this reason may struggle to ensure direct participation in initiatives and discussion arenas at EU level. Their participation in this survey is seen as unique opportunity to gain a better understanding of their needs and priorities concerning urban development.
How cities are classified in this report, according to their size
- Towns → Below 50 000 inhabitants
- Small cities → Between 50 000 and 250 000 inhabitants
- Medium cities → Between 250 000 and 500 000 inhabitants
- Large cities → Between 500 000 and 1 000 000 inhabitants
- Extra-large cities → More than 1 000 000 inhabitant
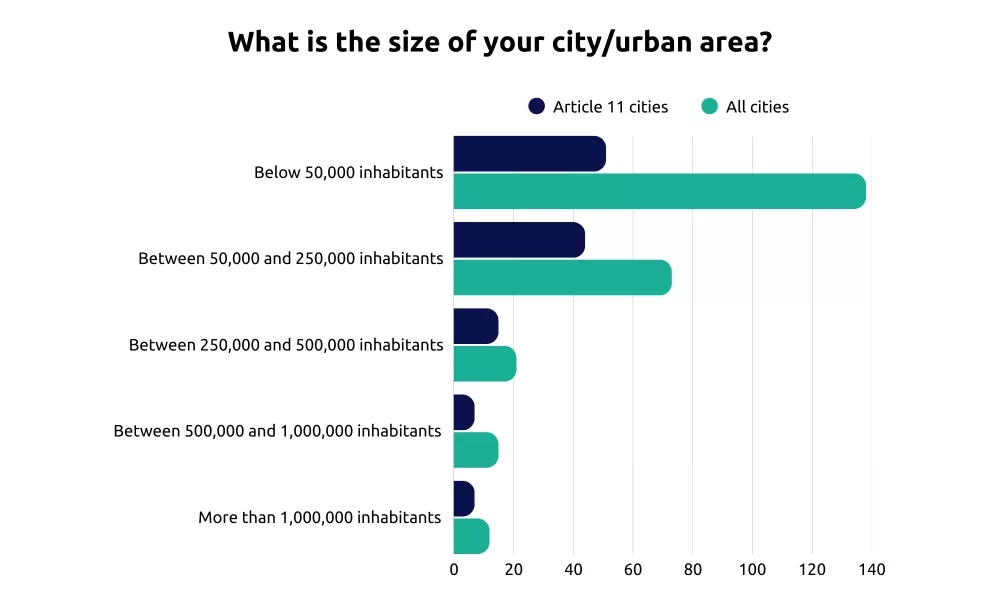
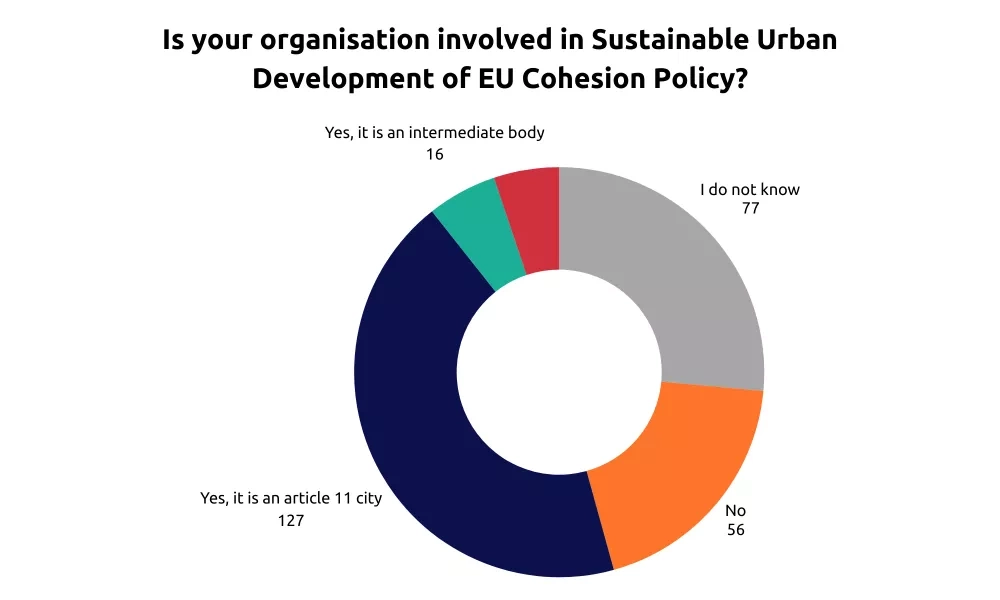
Another important target group for EUI activities is cities benefiting from the sustainable urban development (SUD) measure of 2021-2027 EU cohesion policy, as defined in Article 11 of Regulation (EU) 2021/1058 on the European Regional Development Fund and Cohesion Fund. A positive outcome related to this target is that, of the 291 public authorities who responded to the survey, 158 identified themselves as being involved in sustainable urban development, spanning 21 Member States. The biggest group was Article 11 cities (127 responses, or 44%), followed by organisations acting as an intermediate body (16), and regional or national managing authorities (15). It is, however, necessary to take into account the fact that 26% of respondents did not know whether or not their organisation was involved in SUD.
Three quarters of Article 11 cities responding to the survey are actually towns or small cities: 41% have a population of under 50 000 inhabitants, and 35% have 50 000-250 000 inhabitants.
When looking at the role of respondents representing urban authorities, only 11% were political representatives, such as mayors, deputy mayors or council members. The vast majority (89%) were civil servants, and in a few cases external staff working for the municipality. Among civil servants, 24% said they are working in the European affairs department, 16% in an urban planning department, and the rest in other departments such as investment, development or strategic development. Additionally, 39% did not specify their department.

About this resource
Similar content